Bank of America 2011 Annual Report Download - page 68
Download and view the complete annual report
Please find page 68 of the 2011 Bank of America annual report below. You can navigate through the pages in the report by either clicking on the pages listed below, or by using the keyword search tool below to find specific information within the annual report.-
 1
1 -
2
-
3
-
4
-
5
-
6
-
7
-
8
-
9
-
10
-
11
-
12
-
13
-
14
-
15
-
16
-
17
-
18
-
19
-
20
-
21
-
22
-
23
-
24
-
25
-
26
-
27
-
28
-
29
-
30
-
31
-
32
-
33
-
34
-
35
-
36
-
37
-
38
-
39
-
40
-
41
-
42
-
43
-
44
-
45
-
46
-
47
-
48
-
49
-
50
-
51
-
52
-
53
-
54
-
55
-
56
-
57
-
 58
58 -
 59
59 -
 60
60 -
 61
61 -
 62
62 -
 63
63 -
 64
64 -
 65
65 -
 66
66 -
 67
67 -
 68
68 -
 69
69 -
 70
70 -
 71
71 -
 72
72 -
 73
73 -
 74
74 -
 75
75 -
 76
76 -
 77
77 -
 78
78 -
79
-
80
-
81
-
82
-
83
-
84
-
85
-
86
-
87
-
88
-
89
-
90
-
91
-
92
-
93
-
94
-
95
-
96
-
97
-
98
-
99
-
100
-
101
-
102
-
103
-
104
-
105
-
106
-
107
-
108
-
109
-
110
-
111
-
112
-
113
-
114
-
115
-
116
-
117
-
118
-
119
-
120
-
121
-
122
-
123
-
124
-
125
-
126
-
127
-
128
-
129
-
130
-
131
-
132
-
133
-
134
-
135
-
136
-
137
-
138
-
139
-
140
-
141
-
142
-
143
-
144
-
145
-
146
-
147
-
148
-
149
-
150
-
151
-
152
-
153
-
154
-
155
-
156
-
157
-
158
-
159
-
160
-
161
-
162
-
163
-
164
-
165
-
166
-
167
-
168
-
169
-
170
-
171
-
172
-
173
-
174
-
175
-
176
-
177
-
178
-
179
-
180
-
181
-
182
-
183
-
184
-
185
-
186
-
187
-
188
-
189
-
190
-
191
-
192
-
193
-
194
-
195
-
196
-
197
-
198
-
199
-
200
-
201
-
202
-
203
-
204
-
205
-
206
-
207
-
208
-
209
-
210
-
211
-
212
-
213
-
214
-
215
-
216
-
217
-
218
-
219
-
220
-
221
-
222
-
223
-
224
-
225
-
226
-
227
-
228
-
229
-
230
-
231
-
232
-
233
-
234
-
235
-
236
-
237
-
238
-
239
-
240
-
241
-
242
-
243
-
244
-
245
-
246
-
247
-
248
-
249
-
250
-
251
-
252
-
253
-
254
-
255
-
256
-
257
-
258
-
259
-
260
-
261
-
262
-
263
-
264
-
265
-
266
-
267
-
268
-
269
-
270
-
271
-
272
-
273
-
274
-
275
-
276
 |
 |
66 Bank of America 2011
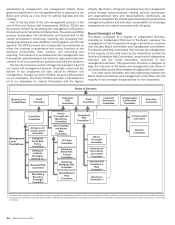
The ICAAP incorporates capital forecasts, stress test results,
economic capital, qualitative risk assessments and assessment
of regulatory changes. We generate monthly regulatory capital and
economic capital forecasts that are aligned to the most recent
earnings, balance sheet and risk forecasts. We utilize quarterly
stress tests to assess the potential impacts to our balance sheet,
earnings, capital and liquidity for a variety of economic stress
scenarios. We perform qualitative risk assessments to identify
and assess material risks not fully captured in the forecasts, stress
tests or economic capital. Given the significant proposed
regulatory capital changes, we also regularly assess the potential
capital impacts and monitor associated mitigation actions.
Management continuously assesses ICAAP results and provides
documented quarterly assessments of the adequacy of the capital
guidelines and capital position to the Board or its committees.
Capital management is integrated into the risk and governance
processes, as capital is a key consideration in the development
of the strategic plan, risk appetite and risk limits. Economic capital
is allocated to each business unit and used to perform risk-
adjusted return analysis at the business unit, client relationship
and transaction levels.
Regulatory Capital
As a financial services holding company, we are subject to the risk-
based capital guidelines (Basel I) issued by federal banking
regulators. At December 31, 2011, we operated banking activities
primarily under two charters: BANA and FIA Card Services, N.A.
(FIA). Under these guidelines, the Corporation and its affiliated
banking entities measure capital adequacy based on Tier 1
common capital, Tier 1 capital and Total capital (Tier 1 plus Tier
2 capital). Capital ratios are calculated by dividing each capital
amount by risk-weighted assets. Additionally, Tier 1 capital is
divided by adjusted quarterly average total assets to derive the
Tier 1 leverage ratio.
Tier 1 capital is calculated as the sum of “core capital
elements.” The predominate components of core capital elements
are qualifying common stockholders’ equity and qualifying
noncumulative perpetual preferred stock. Also included in Tier 1
capital are qualifying trust preferred securities (Trust Securities),
hybrid securities and qualifying non-controlling interest in
subsidiaries which are subject to the rules governing “restricted
core capital elements.” Goodwill, other disallowed intangible
assets, disallowed deferred tax assets and the cumulative
changes in fair value of all financial liabilities accounted for under
the fair value option that are included in retained earnings and are
attributable to changes in the company’s own creditworthiness are
deducted from the sum of the core capital elements. Total capital
is Tier 1 plus supplementary Tier 2 capital elements such as
qualifying subordinated debt, a limited portion of the allowance
for loan and lease losses, and a portion of net unrealized gains
on AFS marketable equity securities. Tier 1 common capital is not
an official regulatory ratio, but was introduced by the Federal
Reserve during the Supervisory Capital Assessment Program in
2009. Tier 1 common capital is Tier 1 capital less preferred stock,
Trust Securities, hybrid securities and qualifying non-controlling
interest in subsidiaries.
Risk-weighted assets are calculated for credit risk for all on-
and off-balance sheet credit exposures and for market risk on
trading assets and liabilities, including derivative exposures. Credit
risk risk-weighted assets are calculated by assigning a prescribed
risk-weight to all on-balance sheet assets and to the credit
equivalent amount of certain off-balance sheet exposures. The
risk-weight is defined in the regulatory rules based upon the obligor
or guarantor type and collateral if applicable. Off-balance sheet
exposures include financial guarantees, unfunded lending
commitments, letters of credit and derivatives. Market risk risk-
weighted assets are calculated using risk models for the trading
account positions, including all foreign exchange and commodity
positions regardless of the applicable accounting guidance. Under
Basel I there are no risk-weighted assets calculated for operational
risk. Any assets that are a direct deduction from the computation
of capital are excluded from risk-weighted assets and adjusted
average total assets consistent with regulatory guidance.
The Corporation has issued notes to certain unconsolidated
corporate-sponsored trust companies which issued Trust
Securities and hybrid securities. In accordance with Federal
Reserve guidance, Trust Securities continue to qualify as Tier 1
capital with revised quantitative limits. As a result, the Corporation
includes qualifying Trust Securities in Tier 1 capital. The Financial
Reform Act includes a provision under which the Corporation’s
outstanding Trust Securities in the aggregate amount of $16.1
billion (approximately 125 bps of Tier 1 capital) at December 31,
2011 will be excluded from Tier 1 capital, with the exclusion to be
phased in incrementally over a three-year period beginning January
1, 2013. This amount excludes $633 million of hybrid Trust
Securities that are expected to be converted to preferred stock
prior to the date of implementation. The treatment of Trust
Securities during the phase-in period is unknown and is subject
to future rulemaking.
For additional information on these and other regulatory
requirements, see Note 18 – Regulatory Requirements and
Restrictions to the Consolidated Financial Statements.
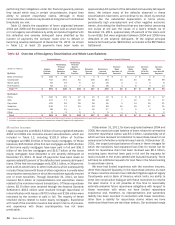
Capital Composition and Ratios
Tier 1 common capital increased $1.6 billion to $126.7 billion at
December 31, 2011 compared to 2010. The increase was driven
primarily by the sale of CCB shares, the exchanges of preferred
shares, Trust Securities and hybrid securities for common stock
and debt, and the warrants issued in connection with the
investment made by Berkshire, partially offset by an increase in
deferred tax assets disallowed for regulatory capital purposes.
The sales related to CCB increased Tier 1 common capital $6.4