Bank of America 2011 Annual Report Download - page 129
Download and view the complete annual report
Please find page 129 of the 2011 Bank of America annual report below. You can navigate through the pages in the report by either clicking on the pages listed below, or by using the keyword search tool below to find specific information within the annual report.-
 1
1 -
2
-
3
-
4
-
5
-
6
-
7
-
8
-
9
-
10
-
11
-
12
-
13
-
14
-
15
-
16
-
17
-
18
-
19
-
20
-
21
-
22
-
23
-
24
-
25
-
26
-
27
-
28
-
29
-
30
-
31
-
32
-
33
-
34
-
35
-
36
-
37
-
38
-
39
-
40
-
41
-
42
-
43
-
44
-
45
-
46
-
47
-
48
-
49
-
50
-
51
-
52
-
53
-
54
-
55
-
56
-
57
-
58
-
59
-
60
-
61
-
62
-
63
-
64
-
65
-
66
-
67
-
68
-
69
-
70
-
71
-
72
-
73
-
74
-
75
-
76
-
77
-
78
-
79
-
80
-
81
-
82
-
83
-
84
-
85
-
86
-
87
-
88
-
89
-
90
-
91
-
92
-
93
-
94
-
95
-
96
-
97
-
98
-
99
-
100
-
101
-
102
-
103
-
104
-
105
-
106
-
107
-
108
-
109
-
110
-
111
-
112
-
113
-
114
-
115
-
116
-
117
-
118
-
 119
119 -
 120
120 -
 121
121 -
 122
122 -
 123
123 -
 124
124 -
 125
125 -
 126
126 -
 127
127 -
 128
128 -
 129
129 -
 130
130 -
 131
131 -
 132
132 -
 133
133 -
 134
134 -
 135
135 -
 136
136 -
 137
137 -
 138
138 -
 139
139 -
140
-
141
-
142
-
143
-
144
-
145
-
146
-
147
-
148
-
149
-
150
-
151
-
152
-
153
-
154
-
155
-
156
-
157
-
158
-
159
-
160
-
161
-
162
-
163
-
164
-
165
-
166
-
167
-
168
-
169
-
170
-
171
-
172
-
173
-
174
-
175
-
176
-
177
-
178
-
179
-
180
-
181
-
182
-
183
-
184
-
185
-
186
-
187
-
188
-
189
-
190
-
191
-
192
-
193
-
194
-
195
-
196
-
197
-
198
-
199
-
200
-
201
-
202
-
203
-
204
-
205
-
206
-
207
-
208
-
209
-
210
-
211
-
212
-
213
-
214
-
215
-
216
-
217
-
218
-
219
-
220
-
221
-
222
-
223
-
224
-
225
-
226
-
227
-
228
-
229
-
230
-
231
-
232
-
233
-
234
-
235
-
236
-
237
-
238
-
239
-
240
-
241
-
242
-
243
-
244
-
245
-
246
-
247
-
248
-
249
-
250
-
251
-
252
-
253
-
254
-
255
-
256
-
257
-
258
-
259
-
260
-
261
-
262
-
263
-
264
-
265
-
266
-
267
-
268
-
269
-
270
-
271
-
272
-
273
-
274
-
275
-
276
 |
 |

Bank of America 2011 127
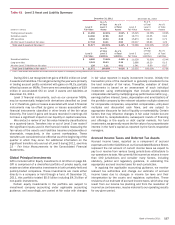
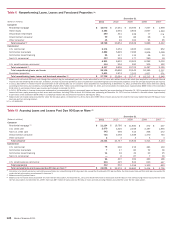
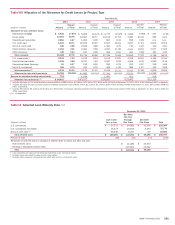
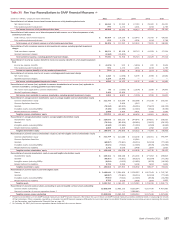
Table IV Outstanding Loans and Leases
(Dollars in millions)
Consumer
Residential mortgage (2)
Home equity
Discontinued real estate (3)
U.S. credit card
Non-U.S. credit card
Direct/Indirect consumer (4)
Other consumer (5)
Total consumer loans
Consumer loans accounted for under the fair value option (6)
Total consumer
Commercial
U.S. commercial (7)
Commercial real estate (8)
Commercial lease financing
Non-U.S. commercial
Total commercial loans
Commercial loans accounted for under the fair value option (6)
Total commercial
Total loans and leases
December 31
2011
$ 262,290
124,699
11,095
102,291
14,418
89,713
2,688
607,194
2,190
609,384
193,199
39,596
21,989
55,418
310,202
6,614
316,816
$ 926,200
2010 (1)
$257,973
137,981
13,108
113,785
27,465
90,308
2,830
643,450
—
643,450
190,305
49,393
21,942
32,029
293,669
3,321
296,990
$940,440
2009
$242,129
149,126
14,854
49,453
21,656
97,236
3,110
577,564
—
577,564
198,903
69,447
22,199
27,079
317,628
4,936
322,564
$900,128
2008
$248,063
152,483
19,981
64,128
17,146
83,436
3,442
588,679
—
588,679
219,233
64,701
22,400
31,020
337,354
5,413
342,767
$931,446
2007
$ 274,949
114,820
n/a
65,774
14,950
76,538
4,170
551,201
—
551,201
208,297
61,298
22,582
28,376
320,553
4,590
325,143
$ 876,344
(1) 2011 and 2010 periods are presented in accordance with new consolidation guidance.
(2) Includes non-U.S. residential mortgages of $85 million, $90 million and $552 million at December 31, 2011, 2010 and 2009, respectively. There were no material non-U.S. residential mortgage
loans prior to January 1, 2009.
(3) Includes $9.9 billion, $11.8 billion, $13.4 billion and $18.2 billion of pay option loans, and $1.2 billion, $1.3 billion, $1.5 billion and $1.8 billion of subprime loans at December 31, 2011, 2010,
2009 and 2008, respectively. We no longer originate these products.
(4) Includes dealer financial services loans of $43.0 billion, $43.3 billion, $41.6 billion, $40.1 billion and $37.2 billion; consumer lending loans of $8.0 billion, $12.4 billion, $19.7 billion, $28.2 billion
and $24.4 billion; U.S. securities-based lending margin loans of $23.6 billion, $16.6 billion, $12.9 billion, $0 and $0; student loans of $6.0 billion, $6.8 billion, $10.8 billion, $8.3 billion and
$4.7 billion; non-U.S. consumer loans of $7.6 billion, $8.0 billion, $8.0 billion, $1.8 billion and $3.4 billion; and other consumer loans of $1.5 billion, $3.2 billion, $4.2 billion, $5.0 billion and
$6.8 billion at December 31, 2011, 2010, 2009, 2008 and 2007, respectively.
(5) Includes consumer finance loans of $1.7 billion, $1.9 billion, $2.3 billion, $2.6 billion and $3.0 billion, other non-U.S. consumer loans of $929 million, $803 million, $709 million, $618 million and
$829 million, and consumer overdrafts of $103 million, $88 million, $144 million, $211 million and $320 million at December 31, 2011, 2010, 2009, 2008 and 2007, respectively.
(6) Certain consumer loans are accounted for under the fair value option and include residential mortgage loans of $906 million and discontinued real estate loans of $1.3 billion at December 31,
2011. There were no consumer loans accounted for under the fair value option prior to 2011. Certain commercial loans are accounted for under the fair value option and include U.S. commercial
loans of $2.2 billion, $1.6 billion, $3.0 billion, $3.5 billion and $3.5 billion, commercial real estate loans of $0, $79 million, $90 million, $203 million and $304 million and non-U.S. commercial
loans of $4.4 billion, $1.7 billion, $1.9 billion, $1.7 billion and $790 million at December 31, 2011, 2010, 2009, 2008 and 2007, respectively.
(7) Includes U.S. small business commercial loans, including card-related products, of $13.3 billion, $14.7 billion, $17.5 billion, $19.1 billion and $19.3 billion at December 31, 2011, 2010, 2009,
2008 and 2007, respectively.
(8) Includes U.S. commercial real estate loans of $37.8 billion, $46.9 billion, $66.5 billion, $63.7 billion and $60.2 billion, and non-U.S. commercial real estate loans of $1.8 billion, $2.5 billion,
$3.0 billion, $979 million and $1.1 billion at December 31, 2011, 2010, 2009, 2008 and 2007, respectively.
n/a = not applicable