Bank of America 2011 Annual Report Download - page 96
Download and view the complete annual report
Please find page 96 of the 2011 Bank of America annual report below. You can navigate through the pages in the report by either clicking on the pages listed below, or by using the keyword search tool below to find specific information within the annual report.-
 1
1 -
2
-
3
-
4
-
5
-
6
-
7
-
8
-
9
-
10
-
11
-
12
-
13
-
14
-
15
-
16
-
17
-
18
-
19
-
20
-
21
-
22
-
23
-
24
-
25
-
26
-
27
-
28
-
29
-
30
-
31
-
32
-
33
-
34
-
35
-
36
-
37
-
38
-
39
-
40
-
41
-
42
-
43
-
44
-
45
-
46
-
47
-
48
-
49
-
50
-
51
-
52
-
53
-
54
-
55
-
56
-
57
-
58
-
59
-
60
-
61
-
62
-
63
-
64
-
65
-
66
-
67
-
68
-
69
-
70
-
71
-
72
-
73
-
74
-
75
-
76
-
77
-
78
-
79
-
80
-
81
-
82
-
83
-
84
-
85
-
 86
86 -
 87
87 -
 88
88 -
 89
89 -
 90
90 -
 91
91 -
 92
92 -
 93
93 -
 94
94 -
 95
95 -
 96
96 -
 97
97 -
 98
98 -
 99
99 -
 100
100 -
 101
101 -
 102
102 -
 103
103 -
 104
104 -
 105
105 -
 106
106 -
107
-
108
-
109
-
110
-
111
-
112
-
113
-
114
-
115
-
116
-
117
-
118
-
119
-
120
-
121
-
122
-
123
-
124
-
125
-
126
-
127
-
128
-
129
-
130
-
131
-
132
-
133
-
134
-
135
-
136
-
137
-
138
-
139
-
140
-
141
-
142
-
143
-
144
-
145
-
146
-
147
-
148
-
149
-
150
-
151
-
152
-
153
-
154
-
155
-
156
-
157
-
158
-
159
-
160
-
161
-
162
-
163
-
164
-
165
-
166
-
167
-
168
-
169
-
170
-
171
-
172
-
173
-
174
-
175
-
176
-
177
-
178
-
179
-
180
-
181
-
182
-
183
-
184
-
185
-
186
-
187
-
188
-
189
-
190
-
191
-
192
-
193
-
194
-
195
-
196
-
197
-
198
-
199
-
200
-
201
-
202
-
203
-
204
-
205
-
206
-
207
-
208
-
209
-
210
-
211
-
212
-
213
-
214
-
215
-
216
-
217
-
218
-
219
-
220
-
221
-
222
-
223
-
224
-
225
-
226
-
227
-
228
-
229
-
230
-
231
-
232
-
233
-
234
-
235
-
236
-
237
-
238
-
239
-
240
-
241
-
242
-
243
-
244
-
245
-
246
-
247
-
248
-
249
-
250
-
251
-
252
-
253
-
254
-
255
-
256
-
257
-
258
-
259
-
260
-
261
-
262
-
263
-
264
-
265
-
266
-
267
-
268
-
269
-
270
-
271
-
272
-
273
-
274
-
275
-
276
 |
 |

94 Bank of America 2011
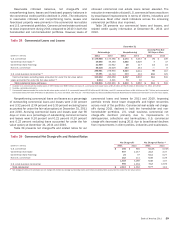
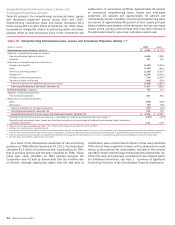
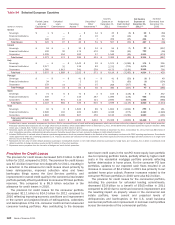
Nonperforming Commercial Loans, Leases and
Foreclosed Properties Activity
Table 45 presents the nonperforming commercial loans, leases
and foreclosed properties activity during 2011 and 2010.
Nonperforming commercial loans and leases decreased $3.5
billion during 2011 to $6.3 billion at December 31, 2011 driven
by paydowns, charge-offs, returns to performing status and sales,
partially offset by new nonaccrual loans in the commercial real
estate and U.S. commercial portfolios. Approximately 96 percent
of commercial nonperforming loans, leases and foreclosed
properties are secured and approximately 51 percent are
contractually current. In addition, commercial nonperforming loans
are carried at approximately 68 percent of their unpaid principal
balance before consideration of the allowance for loan and lease
losses as the carrying value of these loans has been reduced to
the estimated property value less estimated costs to sell.
Table 45
(Dollars in millions)
Nonperforming loans and leases, January 1
Additions to nonperforming loans and leases:
New nonperforming loans and leases
Advances
Reductions in nonperforming loans and leases:
Paydowns and payoffs
Sales
Returns to performing status (3)
Charge-offs (4)
Transfers to foreclosed properties
Transfers to loans held-for-sale
Total net reductions to nonperforming loans and leases
Total nonperforming loans and leases, December 31
Foreclosed properties, January 1
Additions to foreclosed properties:
New foreclosed properties
Reductions in foreclosed properties:
Sales
Write-downs
Total net reductions to foreclosed properties
Total foreclosed properties, December 31
Nonperforming commercial loans, leases and foreclosed properties, December 31
Nonperforming commercial loans and leases as a percentage of outstanding commercial loans and leases (5)
Nonperforming commercial loans, leases and foreclosed properties as a percentage of outstanding commercial loans, leases and
foreclosed properties (5)
Nonperforming Commercial Loans, Leases and Foreclosed Properties Activity (1, 2)
2011
$ 9,836
4,656
157
(3,457)
(1,153)
(1,183)
(1,576)
(774)
(169)
(3,499)
6,337
725
507
(539)
(81)
(113)
612
$ 6,949
2.04%
2.24
2010
$ 12,703
7,809
330
(3,938)
(841)
(1,607)
(3,221)
(1,045)
(354)
(2,867)
9,836
777
818
(780)
(90)
(52)
725
$ 10,561
3.35%
3.59
(1) Balances do not include nonperforming LHFS of $1.1 billion and $1.5 billion at December 31, 2011 and 2010.
(2) Includes U.S. small business commercial activity.
(3) Commercial loans and leases may be returned to performing status when all principal and interest is current and full repayment of the remaining contractual principal and interest is expected or
when the loan otherwise becomes well-secured and is in the process of collection. TDRs are generally classified as performing after a sustained period of demonstrated payment performance.
(4) Business card loans are not classified as nonperforming; therefore, the charge-offs on these loans have no impact on nonperforming activity and accordingly are excluded from this table.
(5) Excludes loans accounted for under the fair value option.
As a result of the retrospective application of new accounting
guidance on TDRs effective September 30, 2011, the Corporation
classified $1.1 billion of commercial loan modifications as TDRs
that in previous periods had not been classified as TDRs. These
loans were newly identified as TDRs typically because the
Corporation was not able to demonstrate that the modified rate
of interest, although significantly higher than the rate prior to
modification, was a market rate of interest. These newly identified
TDRs did not have a significant impact on the allowance for credit
losses or the provision for credit losses. Included in this amount
was $402 million of performing commercial loans at December 31,
2011 that were not previously considered to be impaired loans.
For additional information, see Note 1 – Summary of Significant
Accounting Principles to the Consolidated Financial Statements.