Bank of America 2011 Annual Report Download - page 94
Download and view the complete annual report
Please find page 94 of the 2011 Bank of America annual report below. You can navigate through the pages in the report by either clicking on the pages listed below, or by using the keyword search tool below to find specific information within the annual report.-
 1
1 -
2
-
3
-
4
-
5
-
6
-
7
-
8
-
9
-
10
-
11
-
12
-
13
-
14
-
15
-
16
-
17
-
18
-
19
-
20
-
21
-
22
-
23
-
24
-
25
-
26
-
27
-
28
-
29
-
30
-
31
-
32
-
33
-
34
-
35
-
36
-
37
-
38
-
39
-
40
-
41
-
42
-
43
-
44
-
45
-
46
-
47
-
48
-
49
-
50
-
51
-
52
-
53
-
54
-
55
-
56
-
57
-
58
-
59
-
60
-
61
-
62
-
63
-
64
-
65
-
66
-
67
-
68
-
69
-
70
-
71
-
72
-
73
-
74
-
75
-
76
-
77
-
78
-
79
-
80
-
81
-
82
-
83
-
 84
84 -
 85
85 -
 86
86 -
 87
87 -
 88
88 -
 89
89 -
 90
90 -
 91
91 -
 92
92 -
 93
93 -
 94
94 -
 95
95 -
 96
96 -
 97
97 -
 98
98 -
 99
99 -
 100
100 -
 101
101 -
 102
102 -
 103
103 -
 104
104 -
105
-
106
-
107
-
108
-
109
-
110
-
111
-
112
-
113
-
114
-
115
-
116
-
117
-
118
-
119
-
120
-
121
-
122
-
123
-
124
-
125
-
126
-
127
-
128
-
129
-
130
-
131
-
132
-
133
-
134
-
135
-
136
-
137
-
138
-
139
-
140
-
141
-
142
-
143
-
144
-
145
-
146
-
147
-
148
-
149
-
150
-
151
-
152
-
153
-
154
-
155
-
156
-
157
-
158
-
159
-
160
-
161
-
162
-
163
-
164
-
165
-
166
-
167
-
168
-
169
-
170
-
171
-
172
-
173
-
174
-
175
-
176
-
177
-
178
-
179
-
180
-
181
-
182
-
183
-
184
-
185
-
186
-
187
-
188
-
189
-
190
-
191
-
192
-
193
-
194
-
195
-
196
-
197
-
198
-
199
-
200
-
201
-
202
-
203
-
204
-
205
-
206
-
207
-
208
-
209
-
210
-
211
-
212
-
213
-
214
-
215
-
216
-
217
-
218
-
219
-
220
-
221
-
222
-
223
-
224
-
225
-
226
-
227
-
228
-
229
-
230
-
231
-
232
-
233
-
234
-
235
-
236
-
237
-
238
-
239
-
240
-
241
-
242
-
243
-
244
-
245
-
246
-
247
-
248
-
249
-
250
-
251
-
252
-
253
-
254
-
255
-
256
-
257
-
258
-
259
-
260
-
261
-
262
-
263
-
264
-
265
-
266
-
267
-
268
-
269
-
270
-
271
-
272
-
273
-
274
-
275
-
276
 |
 |

92 Bank of America 2011
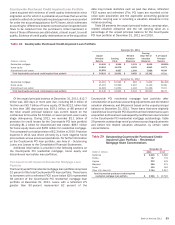
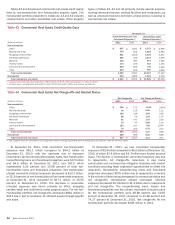
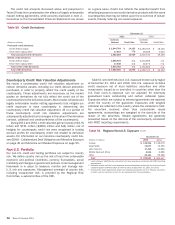
Tables 43 and 44 present commercial real estate credit quality
data by non-homebuilder and homebuilder property types. The
homebuilder portfolio presented in Tables 42, 43 and 44 includes
condominiums and other residential real estate. Other property
types in Tables 42, 43 and 44 primarily include special purpose,
nursing/retirement homes, medical facilities and restaurants, as
well as unsecured loans to borrowers whose primary business is
commercial real estate.
Table 43
(Dollars in millions)
Non-homebuilder
Office
Multi-family rental
Shopping centers/retail
Industrial/warehouse
Multi-use
Hotels/motels
Land and land development
Other
Total non-homebuilder
Homebuilder
Total commercial real estate
Commercial Real Estate Credit Quality Data
December 31
Nonperforming Loans and
Foreclosed Properties (1)
2011
$807
339
561
521
345
173
530
223
3,499
993
$ 4,492
2010
$ 1,061
500
1,000
420
483
139
820
168
4,591
1,963
$ 6,554
Utilized Reservable
Criticized Exposure (2)
2011
$ 2,375
1,604
1,378
1,317
971
716
749
997
10,107
1,418
$11,525
2010
$ 3,956
2,940
2,837
1,878
1,316
1,191
1,420
1,604
17,142
3,376
$ 20,518
(1) Includes commercial foreclosed properties of $612 million and $725 million at December 31, 2011 and 2010.
(2) Includes loans, excluding those accounted for under the fair value option, SBLCs and bankers’ acceptances.
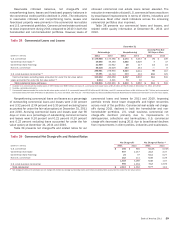
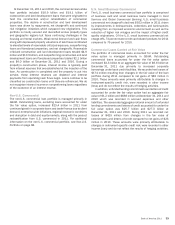
Table 44
(Dollars in millions)
Non-homebuilder
Office
Multi-family rental
Shopping centers/retail
Industrial/warehouse
Multi-use
Hotels/motels
Land and land development
Other
Total non-homebuilder
Homebuilder
Total commercial real estate
Commercial Real Estate Net Charge-offs and Related Ratios
Net Charge-offs
2011
$126
36
184
88
61
23
152
19
689
258
$947
2010
$ 273
116
318
59
143
45
377
220
1,551
466
$ 2,017
Net Charge-off Ratios (1)
2011
1.51%
0.52
2.69
1.94
1.63
0.86
7.58
0.33
1.67
8.00
2.13
2010
2.49%
1.21
3.56
1.07
2.92
1.02
13.04
3.14
2.86
8.26
3.37
(1) Net charge-off ratios are calculated as net charge-offs divided by average outstanding loans excluding loans accounted for under the fair value option.
At December 31, 2011, total committed non-homebuilder
exposure was $53.1 billion compared to $64.2 billion at
December 31, 2010, with the decrease due to exposure
reductions in all non-homebuilder property types. Non-homebuilder
nonperforming loans and foreclosed properties were $3.5 billion
and $4.6 billion at December 31, 2011 and 2010, which
represented 9.29 percent and 10.08 percent of total non-
homebuilder loans and foreclosed properties. Non-homebuilder
utilized reservable criticized exposure decreased to $10.1 billion,
or 25.34 percent of non-homebuilder utilized reservable exposure,
at December 31, 2011 compared to $17.1 billion, or 35.55
percent, at December 31, 2010. The decrease in reservable
criticized exposure was driven primarily by office, shopping
centers/retail and multi-family rental property types. For the non-
homebuilder portfolio, net charge-offs decreased $862 million in
2011 due in part to resolution of criticized assets through payoffs
and sales.
At December 31, 2011, we had committed homebuilder
exposure of $3.9 billion compared to $6.0 billion at December 31,
2010, of which $2.4 billion and $4.3 billion were funded secured
loans. The decline in homebuilder committed exposure was due
to repayments, net charge-offs, reductions in new home
construction and continued risk mitigation initiatives with market
conditions providing fewer origination opportunities to offset the
reductions. Homebuilder nonperforming loans and foreclosed
properties decreased $970 million due to repayments, a decline
in the volume of loans being downgraded to nonaccrual status and
net charge-offs. Homebuilder utilized reservable criticized
exposure decreased $2.0 billion to $1.4 billion due to repayments
and net charge-offs. The nonperforming loans, leases and
foreclosed properties and the utilized reservable criticized ratios
for the homebuilder portfolio were 38.89 percent and 54.65
percent at December 31, 2011 compared to 42.80 percent and
74.27 percent at December 31, 2010. Net charge-offs for the
homebuilder portfolio decreased $208 million in 2011.