Bank of America 2011 Annual Report Download - page 179
Download and view the complete annual report
Please find page 179 of the 2011 Bank of America annual report below. You can navigate through the pages in the report by either clicking on the pages listed below, or by using the keyword search tool below to find specific information within the annual report.-
 1
1 -
2
-
3
-
4
-
5
-
6
-
7
-
8
-
9
-
10
-
11
-
12
-
13
-
14
-
15
-
16
-
17
-
18
-
19
-
20
-
21
-
22
-
23
-
24
-
25
-
26
-
27
-
28
-
29
-
30
-
31
-
32
-
33
-
34
-
35
-
36
-
37
-
38
-
39
-
40
-
41
-
42
-
43
-
44
-
45
-
46
-
47
-
48
-
49
-
50
-
51
-
52
-
53
-
54
-
55
-
56
-
57
-
58
-
59
-
60
-
61
-
62
-
63
-
64
-
65
-
66
-
67
-
68
-
69
-
70
-
71
-
72
-
73
-
74
-
75
-
76
-
77
-
78
-
79
-
80
-
81
-
82
-
83
-
84
-
85
-
86
-
87
-
88
-
89
-
90
-
91
-
92
-
93
-
94
-
95
-
96
-
97
-
98
-
99
-
100
-
101
-
102
-
103
-
104
-
105
-
106
-
107
-
108
-
109
-
110
-
111
-
112
-
113
-
114
-
115
-
116
-
117
-
118
-
119
-
120
-
121
-
122
-
123
-
124
-
125
-
126
-
127
-
128
-
129
-
130
-
131
-
132
-
133
-
134
-
135
-
136
-
137
-
138
-
139
-
140
-
141
-
142
-
143
-
144
-
145
-
146
-
147
-
148
-
149
-
150
-
151
-
152
-
153
-
154
-
155
-
156
-
157
-
158
-
159
-
160
-
161
-
162
-
163
-
164
-
165
-
166
-
167
-
168
-
 169
169 -
 170
170 -
 171
171 -
 172
172 -
 173
173 -
 174
174 -
 175
175 -
 176
176 -
 177
177 -
 178
178 -
 179
179 -
 180
180 -
 181
181 -
 182
182 -
 183
183 -
 184
184 -
 185
185 -
 186
186 -
 187
187 -
 188
188 -
 189
189 -
190
-
191
-
192
-
193
-
194
-
195
-
196
-
197
-
198
-
199
-
200
-
201
-
202
-
203
-
204
-
205
-
206
-
207
-
208
-
209
-
210
-
211
-
212
-
213
-
214
-
215
-
216
-
217
-
218
-
219
-
220
-
221
-
222
-
223
-
224
-
225
-
226
-
227
-
228
-
229
-
230
-
231
-
232
-
233
-
234
-
235
-
236
-
237
-
238
-
239
-
240
-
241
-
242
-
243
-
244
-
245
-
246
-
247
-
248
-
249
-
250
-
251
-
252
-
253
-
254
-
255
-
256
-
257
-
258
-
259
-
260
-
261
-
262
-
263
-
264
-
265
-
266
-
267
-
268
-
269
-
270
-
271
-
272
-
273
-
274
-
275
-
276
 |
 |

Bank of America 2011 177
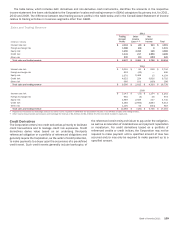
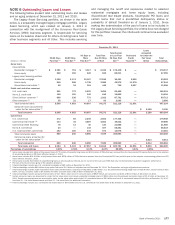
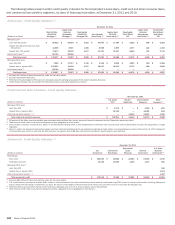
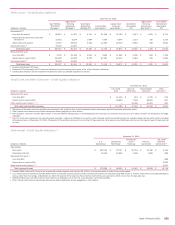
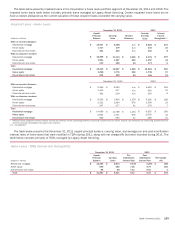
NOTE 6 Outstanding Loans and Leases
The following tables present total outstanding loans and leases
and an aging analysis at December 31, 2011 and 2010.
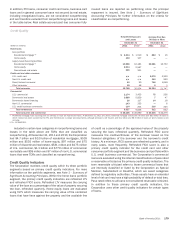
The Legacy Asset Servicing portfolio, as shown in the table
below, is a separately managed legacy mortgage portfolio. Legacy
Asset Servicing, which was created on January 1, 2011 in
connection with the re-alignment of the Consumer Real Estate
Services (CRES) business segment, is responsible for servicing
loans on its balance sheet and for others including loans held in
other business segments and All Other. This includes servicing
and managing the runoff and exposures related to selected
residential mortgages and home equity loans, including
discontinued real estate products, Countrywide PCI loans and
certain loans that met a pre-defined delinquency status or
probability of default threshold as of January 1, 2011. Since
making the determination of the pool of loans to be included in
the Legacy Asset Servicing portfolio, the criteria have not changed
for this portfolio; however, the criteria will continue to be evaluated
over time.
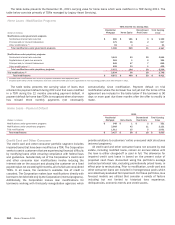
(Dollars in millions)
Home loans
Core portfolio
Residential mortgage (5)
Home equity
Legacy Asset Servicing portfolio
Residential mortgage
Home equity
Discontinued real estate (6)
Credit card and other consumer
U.S. credit card
Non-U.S. credit card
Direct/Indirect consumer (7)
Other consumer (8)
Total consumer loans
Consumer loans accounted for
under the fair value option (9)
Total consumer
Commercial
U.S. commercial
Commercial real estate (10)
Commercial lease financing
Non-U.S. commercial
U.S. small business commercial
Total commercial loans
Commercial loans accounted for
under the fair value option (9)
Total commercial
Total loans and leases
Percentage of outstandings
December 31, 2011
30-59 Days
Past Due (1)
$ 2,151
260
3,195
845
65
981
148
805
55
8,505
8,505
272
133
78
24
142
649
649
$ 9,154
0.99%
60-89 Days
Past Due (1)
$ 751
155
2,174
508
24
772
120
338
21
4,863
4,863
83
44
13
—
100
240
240
$ 5,103
0.55%
90 Days or
More
Past Due (2)
$ 3,017
429
32,167
1,735
351
2,070
342
779
17
40,907
40,907
2,249
3,887
40
143
331
6,650
6,650
$ 47,557
5.13%
Total Past
Due 30 Days
or More
$ 5,919
844
37,536
3,088
440
3,823
610
1,922
93
54,275
54,275
2,604
4,064
131
167
573
7,539
7,539
$ 61,814
6.67%
Total Current
or Less Than
30 Days Past
Due (3)
$ 172,418
66,211
36,451
42,578
798
98,468
13,808
87,791
2,595
521,118
521,118
177,344
35,532
21,858
55,251
12,678
302,663
302,663
$ 823,781
88.95%
Purchased
Credit-
impaired (4)
$—
—
9,966
11,978
9,857
—
—
—
—
31,801
31,801
—
—
—
—
—
—
—
$ 31,801
3.43%
Loans
Accounted
for Under the
Fair Value
Option
$ 2,190
2,190
6,614
6,614
$ 8,804
0.95%
Total
Outstandings
$ 178,337
67,055
83,953
57,644
11,095
102,291
14,418
89,713
2,688
607,194
2,190
609,384
179,948
39,596
21,989
55,418
13,251
310,202
6,614
316,816
$ 926,200
(1) Home loans includes $3.6 billion of fully-insured loans, $770 million of nonperforming loans and $119 million of TDRs that were removed from the Countrywide PCI loan portfolio prior to the adoption
of accounting guidance on PCI loans effective January 1, 2010.
(2) Home loans includes $21.2 billion of fully-insured loans and $378 million of TDRs that were removed from the Countrywide PCI loan portfolio prior to the adoption of accounting guidance on PCI
loans effective January 1, 2010.
(3) Home loans includes $1.8 billion of nonperforming loans as all principal and interest are not current or the loans are TDRs that have not demonstrated sustained repayment performance.
(4) PCI loan amounts are shown gross of the valuation allowance.
(5) Total outstandings includes non-U.S. residential mortgages of $85 million at December 31, 2011.
(6) Total outstandings includes $9.9 billion of pay option loans and $1.2 billion of subprime loans at December 31, 2011. The Corporation no longer originates these products.
(7) Total outstandings includes dealer financial services loans of $43.0 billion, consumer lending loans of $8.0 billion, U.S. securities-based lending margin loans of $23.6 billion, student loans of $6.0
billion, non-U.S. consumer loans of $7.6 billion and other consumer loans of $1.5 billion at December 31, 2011.
(8) Total outstandings includes consumer finance loans of $1.7 billion, other non-U.S. consumer loans of $929 million and consumer overdrafts of $103 million at December 31, 2011.
(9) Certain consumer loans are accounted for under the fair value option and include residential mortgage loans of $906 million and discontinued real estate loans of $1.3 billion at December 31,
2011. Certain commercial loans are accounted for under the fair value option and include U.S. commercial loans of $2.2 billion and non-U.S. commercial loans of $4.4 billion at December 31, 2011.
See Note 22 – Fair Value Measurements and Note 23 – Fair Value Option for additional information.
(10) Total outstandings includes U.S. commercial real estate loans of $37.8 billion and non-U.S. commercial real estate loans of $1.8 billion at December 31, 2011.