Bank of America 2011 Annual Report Download - page 114
Download and view the complete annual report
Please find page 114 of the 2011 Bank of America annual report below. You can navigate through the pages in the report by either clicking on the pages listed below, or by using the keyword search tool below to find specific information within the annual report.-
 1
1 -
2
-
3
-
4
-
5
-
6
-
7
-
8
-
9
-
10
-
11
-
12
-
13
-
14
-
15
-
16
-
17
-
18
-
19
-
20
-
21
-
22
-
23
-
24
-
25
-
26
-
27
-
28
-
29
-
30
-
31
-
32
-
33
-
34
-
35
-
36
-
37
-
38
-
39
-
40
-
41
-
42
-
43
-
44
-
45
-
46
-
47
-
48
-
49
-
50
-
51
-
52
-
53
-
54
-
55
-
56
-
57
-
58
-
59
-
60
-
61
-
62
-
63
-
64
-
65
-
66
-
67
-
68
-
69
-
70
-
71
-
72
-
73
-
74
-
75
-
76
-
77
-
78
-
79
-
80
-
81
-
82
-
83
-
84
-
85
-
86
-
87
-
88
-
89
-
90
-
91
-
92
-
93
-
94
-
95
-
96
-
97
-
98
-
99
-
100
-
101
-
102
-
103
-
 104
104 -
 105
105 -
 106
106 -
 107
107 -
 108
108 -
 109
109 -
 110
110 -
 111
111 -
 112
112 -
 113
113 -
 114
114 -
 115
115 -
 116
116 -
 117
117 -
 118
118 -
 119
119 -
 120
120 -
 121
121 -
 122
122 -
 123
123 -
 124
124 -
125
-
126
-
127
-
128
-
129
-
130
-
131
-
132
-
133
-
134
-
135
-
136
-
137
-
138
-
139
-
140
-
141
-
142
-
143
-
144
-
145
-
146
-
147
-
148
-
149
-
150
-
151
-
152
-
153
-
154
-
155
-
156
-
157
-
158
-
159
-
160
-
161
-
162
-
163
-
164
-
165
-
166
-
167
-
168
-
169
-
170
-
171
-
172
-
173
-
174
-
175
-
176
-
177
-
178
-
179
-
180
-
181
-
182
-
183
-
184
-
185
-
186
-
187
-
188
-
189
-
190
-
191
-
192
-
193
-
194
-
195
-
196
-
197
-
198
-
199
-
200
-
201
-
202
-
203
-
204
-
205
-
206
-
207
-
208
-
209
-
210
-
211
-
212
-
213
-
214
-
215
-
216
-
217
-
218
-
219
-
220
-
221
-
222
-
223
-
224
-
225
-
226
-
227
-
228
-
229
-
230
-
231
-
232
-
233
-
234
-
235
-
236
-
237
-
238
-
239
-
240
-
241
-
242
-
243
-
244
-
245
-
246
-
247
-
248
-
249
-
250
-
251
-
252
-
253
-
254
-
255
-
256
-
257
-
258
-
259
-
260
-
261
-
262
-
263
-
264
-
265
-
266
-
267
-
268
-
269
-
270
-
271
-
272
-
273
-
274
-
275
-
276
 |
 |

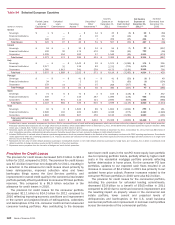
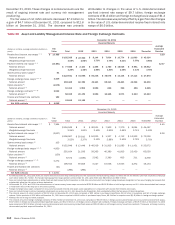
112 Bank of America 2011
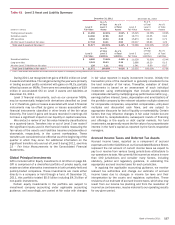
December 31, 2010. These changes in notional amounts are the
result of ongoing interest rate and currency risk management
positioning.
The fair value of net ALM contracts decreased $7.9 billion to
a gain of $4.7 billion at December 31, 2011 compared to $12.6
billion at December 31, 2010. The decrease was primarily
attributable to changes in the value of U.S. dollar-denominated
pay-fixed interest rate swaps of $9.7 billion, foreign exchange
contracts of $1.8 billion and foreign exchange basis swaps of $1.4
billion. The decrease was partially offset by a gain from the changes
in the value of U.S. dollar-denominated receive-fixed interest rate
swaps of $6.6 billion.
Table 60
(Dollars in millions, average estimated duration in
years)
Receive-fixed interest rate swaps (1, 2)
Notional amount
Weighted-average fixed-rate
Pay-fixed interest rate swaps (1, 2)
Notional amount
Weighted-average fixed-rate
Same-currency basis swaps (3)
Notional amount
Foreign exchange basis swaps (2, 4, 5)
Notional amount
Option products (6)
Notional amount (7)
Foreign exchange contracts (2, 5, 8)
Notional amount (7)
Futures and forward rate contracts
Notional amount (7)
Net ALM contracts
Asset and Liability Management Interest Rate and Foreign Exchange Contracts
Fair
Value
$ 13,989
(13,561)
61
3,409
(1,875)
2,522
153
$ 4,698
Fair
Value
$ 7,364
(3,827)
103
4,830
(120)
4,272
(21)
$ 12,601
December 31, 2011
Expected Maturity
Total
$ 105,938
4.09%
$ 77,985
3.29%
$ 222,641
262,428
10,413
52,328
12,160
December 31, 2010
Expected Maturity
Total
$ 104,949
3.94%
$ 156,067
3.02%
$ 152,849
235,164
6,572
109,544
(280)
2012
$ 22,422
2.65%
$ 2,150
1.45%
$ 44,898
60,359
1,500
20,470
12,160
2011
$8
1.00%
$ 50,810
2.37%
$ 13,449
21,936
(1,180)
59,508
(280)
2013
$ 8,144
3.70%
$ 1,496
2.68%
$ 83,248
49,161
2,950
3,556
—
2012
$ 36,201
2.49%
$ 16,205
2.15%
$ 49,509
39,365
2,092
5,427
—
2014
$ 7,604
3.79%
$ 1,750
1.80%
$ 35,678
55,111
600
10,165
—
2013
$ 7,909
3.90%
$ 1,207
2.88%
$ 31,503
46,380
2,390
10,048
—
2015
$ 10,774
4.01%
$ 15,026
2.35%
$ 14,134
20,401
300
2,071
—
2014
$7,270
3.66%
$ 4,712
2.40%
$ 21,085
41,003
603
13,035
—
2016
$ 11,660
3.96%
$ 8,951
3.13%
$ 17,113
43,360
458
2,603
—
2015
$ 8,094
3.71%
$ 10,933
2.75%
$ 11,431
23,430
311
2,372
—
Thereafter
$45,334
4.98%
$48,612
3.76%
$27,570
34,036
4,605
13,463
—
Thereafter
$ 45,467
5.19%
$ 72,200
3.76%
$ 25,872
63,050
2,356
19,154
—
Average
Estimated
Duration
5.99
12.17
Average
Estimated
Duration
4.45
6.03
(1) At both December 31, 2011 and 2010, the receive-fixed interest rate swap notional amounts that represented forward starting swaps and which will not be effective until their respective contractual
start dates totaled $1.7 billion. The forward starting pay-fixed swap positions at December 31, 2011 and 2010 were $8.8 billion and $34.5 billion.
(2) Does not include basis adjustments on either fixed-rate debt issued by the Corporation or AFS debt securities which are hedged using derivatives designated as fair value hedging instruments that
substantially offset the fair values of these derivatives.
(3) At December 31, 2011 and 2010, the notional amount of same-currency basis swaps consisted of $222.6 billion and $152.8 billion in both foreign currency and U.S. dollar-denominated basis swaps
in which both sides of the swap are in the same currency.
(4) Foreign exchange basis swaps consisted of cross-currency variable interest rate swaps used separately or in conjunction with receive-fixed interest rate swaps.
(5) Does not include foreign currency translation adjustments on certain non-U.S. debt issued by the Corporation that substantially offset the fair values of these derivatives.
(6) The notional amount of option products of $10.4 billion at December 31, 2011 were comprised of $30 million in purchased caps/floors, $10.4 billion in swaptions and $0 in foreign exchange
options. Option products of $6.6 billion at December 31, 2010 were comprised of $160 million in purchased caps/floors, $8.2 billion in swaptions and $(1.8) billion in foreign exchange options.
(7) Reflects the net of long and short positions.
(8) The notional amount of foreign exchange contracts of $52.3 billion at December 31, 2011 was comprised of $40.6 billion in foreign currency-denominated and cross-currency receive-fixed swaps,
$647 million in foreign currency-denominated pay-fixed swaps, and $12.4 billion in net foreign currency forward rate contracts. Foreign exchange contracts of $109.5 billion at December 31, 2010
were comprised of $57.6 billion in foreign currency-denominated and cross-currency receive-fixed swaps and $52.0 billion in net foreign currency forward rate contracts. There were no foreign currency-
denominated pay-fixed swaps at December 31, 2010.