Bank of America 2011 Annual Report Download - page 205
Download and view the complete annual report
Please find page 205 of the 2011 Bank of America annual report below. You can navigate through the pages in the report by either clicking on the pages listed below, or by using the keyword search tool below to find specific information within the annual report.-
 1
1 -
2
-
3
-
4
-
5
-
6
-
7
-
8
-
9
-
10
-
11
-
12
-
13
-
14
-
15
-
16
-
17
-
18
-
19
-
20
-
21
-
22
-
23
-
24
-
25
-
26
-
27
-
28
-
29
-
30
-
31
-
32
-
33
-
34
-
35
-
36
-
37
-
38
-
39
-
40
-
41
-
42
-
43
-
44
-
45
-
46
-
47
-
48
-
49
-
50
-
51
-
52
-
53
-
54
-
55
-
56
-
57
-
58
-
59
-
60
-
61
-
62
-
63
-
64
-
65
-
66
-
67
-
68
-
69
-
70
-
71
-
72
-
73
-
74
-
75
-
76
-
77
-
78
-
79
-
80
-
81
-
82
-
83
-
84
-
85
-
86
-
87
-
88
-
89
-
90
-
91
-
92
-
93
-
94
-
95
-
96
-
97
-
98
-
99
-
100
-
101
-
102
-
103
-
104
-
105
-
106
-
107
-
108
-
109
-
110
-
111
-
112
-
113
-
114
-
115
-
116
-
117
-
118
-
119
-
120
-
121
-
122
-
123
-
124
-
125
-
126
-
127
-
128
-
129
-
130
-
131
-
132
-
133
-
134
-
135
-
136
-
137
-
138
-
139
-
140
-
141
-
142
-
143
-
144
-
145
-
146
-
147
-
148
-
149
-
150
-
151
-
152
-
153
-
154
-
155
-
156
-
157
-
158
-
159
-
160
-
161
-
162
-
163
-
164
-
165
-
166
-
167
-
168
-
169
-
170
-
171
-
172
-
173
-
174
-
175
-
176
-
177
-
178
-
179
-
180
-
181
-
182
-
183
-
184
-
185
-
186
-
187
-
188
-
189
-
190
-
191
-
192
-
193
-
194
-
 195
195 -
 196
196 -
 197
197 -
 198
198 -
 199
199 -
 200
200 -
 201
201 -
 202
202 -
 203
203 -
 204
204 -
 205
205 -
 206
206 -
 207
207 -
 208
208 -
 209
209 -
 210
210 -
 211
211 -
 212
212 -
 213
213 -
 214
214 -
 215
215 -
216
-
217
-
218
-
219
-
220
-
221
-
222
-
223
-
224
-
225
-
226
-
227
-
228
-
229
-
230
-
231
-
232
-
233
-
234
-
235
-
236
-
237
-
238
-
239
-
240
-
241
-
242
-
243
-
244
-
245
-
246
-
247
-
248
-
249
-
250
-
251
-
252
-
253
-
254
-
255
-
256
-
257
-
258
-
259
-
260
-
261
-
262
-
263
-
264
-
265
-
266
-
267
-
268
-
269
-
270
-
271
-
272
-
273
-
274
-
275
-
276
 |
 |

Bank of America 2011 203
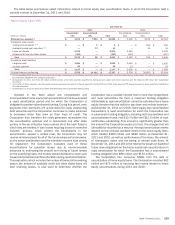
subject of ongoing litigation although, at present, these MI
rescissions are being processed in a manner generally consistent
with those not affected by litigation.
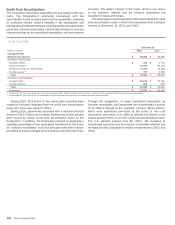
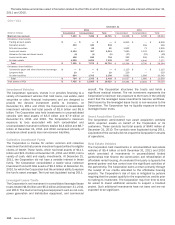
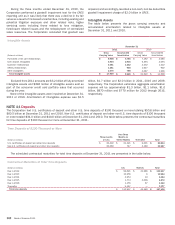
Cash Settlements
As presented in the Loan Repurchases and Indemnification
Payments table, during 2011 and 2010, the Corporation paid $5.2
billion and $5.2 billion to resolve $6.2 billion and $6.6 billion of
repurchase claims through repurchase or reimbursement to the
investor or securitization trust for losses they incurred, resulting
in a loss on the related loans at the time of repurchase or
reimbursement of $3.5 billion and $3.5 billion. Cash paid for loan
repurchases includes the unpaid principal balance of the loan plus
past due interest. The amount of loss for loan repurchases is
reduced by the fair value of the underlying loan collateral. The
repurchase of loans and indemnification payments related to first-
lien and home equity repurchase claims generally resulted from
material breaches of representations and warranties related to
the loans’ material compliance with the applicable underwriting
standards, including borrower misrepresentation, credit
exceptions without sufficient compensating factors and non-
compliance with underwriting procedures. The actual
representations and warranties made in a sales transaction and
the resulting repurchase and indemnification activity can vary by
transaction or investor. A direct relationship between the type of
defect that causes the breach of representations and warranties
and the severity of the realized loss has not been observed.
Transactions to repurchase or indemnification payments related
to first-lien residential mortgages primarily involved the GSEs while
transactions to repurchase or indemnification payments for home
equity loans primarily involved the monoline insurers. In addition
to the amounts previously discussed, the Corporation paid $1.0
billion during 2011 to Assured Guaranty as part of the Assured
Guaranty Settlement. The table below presents first-lien and home
equity loan repurchases and indemnification payments for 2011
and 2010.
Loan Repurchases and Indemnification Payments
(Dollars in millions)
First-lien
Repurchases
Indemnification payments
Total first-lien
Home equity
Repurchases
Indemnification payments
Total home equity
Total first-lien and home equity
December 31
2011
Unpaid
Principal
Balance
$ 2,713
3,329
6,042
28
99
127
$ 6,169
Cash Paid
for
Repurchases
$ 3,067
2,026
5,093
28
99
127
$ 5,220
Loss
$ 1,346
2,026
3,372
14
99
113
$ 3,485
2010
Unpaid
Principal
Balance
$ 2,557
3,785
6,342
78
149
227
$ 6,569
Cash Paid
for
Repurchases
$ 2,799
2,173
4,972
86
146
232
$ 5,204
Loss
$ 1,142
2,173
3,315
44
146
190
$ 3,505
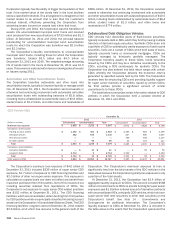
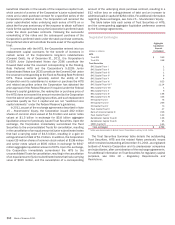
Liability for Representations and Warranties and
Corporate Guarantees
The liability for representations and warranties and corporate
guarantees is included in accrued expenses and other liabilities
on the Consolidated Balance Sheet and the related provision is
included in mortgage banking income (loss). The Representations
and Warranties and Corporate Guarantees table presents a
rollforward of the liability for representations and warranties and
corporate guarantees.
Representations and Warranties and Corporate
Guarantees
(Dollars in millions)
Liability for representations and warranties and
corporate guarantees, beginning of year
Additions for new sales
Charge-offs
Provision
Other
Liability for representations and warranties and
corporate guarantees, December 31
2011
$ 5,438
20
(5,191)
15,591
—
$ 15,858
2010
$ 3,507
30
(4,803)
6,785
(81)
$ 5,438
The liability for representations and warranties is established
when those obligations are both probable and reasonably
estimable. For 2011, the provision for representations and
warranties and corporate guarantees was $15.6 billion compared
to $6.8 billion in 2010. Of the $15.6 billion provision recorded in
2011, $8.6 billion was attributable to the BNY Mellon Settlement
and $7.0 billion was related to other exposures. The BNY Mellon
Settlement led to the determination that the Corporation has
sufficient experience to record a liability related to its exposure
on certain other private-label securitizations. This determination
combined with higher estimated GSE repurchase rates were the
primary drivers of the balance of the provision in 2011. GSE
repurchase rates increased driven by higher than expected claims
during 2011, including claims on loans that defaulted more than
18 months prior to the repurchase request and on loans where
the borrower has made a significant number of payments (e.g., at
least 25 payments), in each case in numbers that were not
expected based on historical claims.