Bank of America 2011 Annual Report Download - page 261
Download and view the complete annual report
Please find page 261 of the 2011 Bank of America annual report below. You can navigate through the pages in the report by either clicking on the pages listed below, or by using the keyword search tool below to find specific information within the annual report.-
 1
1 -
2
-
3
-
4
-
5
-
6
-
7
-
8
-
9
-
10
-
11
-
12
-
13
-
14
-
15
-
16
-
17
-
18
-
19
-
20
-
21
-
22
-
23
-
24
-
25
-
26
-
27
-
28
-
29
-
30
-
31
-
32
-
33
-
34
-
35
-
36
-
37
-
38
-
39
-
40
-
41
-
42
-
43
-
44
-
45
-
46
-
47
-
48
-
49
-
50
-
51
-
52
-
53
-
54
-
55
-
56
-
57
-
58
-
59
-
60
-
61
-
62
-
63
-
64
-
65
-
66
-
67
-
68
-
69
-
70
-
71
-
72
-
73
-
74
-
75
-
76
-
77
-
78
-
79
-
80
-
81
-
82
-
83
-
84
-
85
-
86
-
87
-
88
-
89
-
90
-
91
-
92
-
93
-
94
-
95
-
96
-
97
-
98
-
99
-
100
-
101
-
102
-
103
-
104
-
105
-
106
-
107
-
108
-
109
-
110
-
111
-
112
-
113
-
114
-
115
-
116
-
117
-
118
-
119
-
120
-
121
-
122
-
123
-
124
-
125
-
126
-
127
-
128
-
129
-
130
-
131
-
132
-
133
-
134
-
135
-
136
-
137
-
138
-
139
-
140
-
141
-
142
-
143
-
144
-
145
-
146
-
147
-
148
-
149
-
150
-
151
-
152
-
153
-
154
-
155
-
156
-
157
-
158
-
159
-
160
-
161
-
162
-
163
-
164
-
165
-
166
-
167
-
168
-
169
-
170
-
171
-
172
-
173
-
174
-
175
-
176
-
177
-
178
-
179
-
180
-
181
-
182
-
183
-
184
-
185
-
186
-
187
-
188
-
189
-
190
-
191
-
192
-
193
-
194
-
195
-
196
-
197
-
198
-
199
-
200
-
201
-
202
-
203
-
204
-
205
-
206
-
207
-
208
-
209
-
210
-
211
-
212
-
213
-
214
-
215
-
216
-
217
-
218
-
219
-
220
-
221
-
222
-
223
-
224
-
225
-
226
-
227
-
228
-
229
-
230
-
231
-
232
-
233
-
234
-
235
-
236
-
237
-
238
-
239
-
240
-
241
-
242
-
243
-
244
-
245
-
246
-
247
-
248
-
249
-
250
-
 251
251 -
 252
252 -
 253
253 -
 254
254 -
 255
255 -
 256
256 -
 257
257 -
 258
258 -
 259
259 -
 260
260 -
 261
261 -
 262
262 -
 263
263 -
 264
264 -
 265
265 -
 266
266 -
 267
267 -
 268
268 -
 269
269 -
 270
270 -
 271
271 -
272
-
273
-
274
-
275
-
276
 |
 |

Bank of America 2011 259
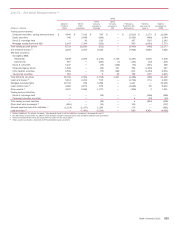
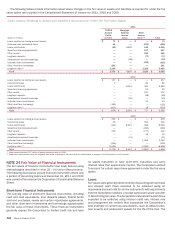
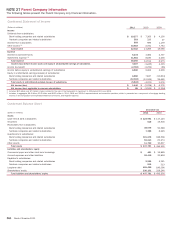
The table below provides information about the fair value carrying amount and the contractual principal outstanding of assets and
liabilities accounted for under the fair value option at December 31, 2011 and 2010.
Fair Value Option Elections
(Dollars in millions)
Loans reported as trading account assets
Consumer and commercial loans
Loans held-for-sale
Securities financing agreements
Other assets
Long-term deposits
Asset-backed secured financings
Unfunded loan commitments
Other short-term borrowings
Long-term debt (1)
December 31
2011
Fair Value
Carrying
Amount
$ 1,151
8,804
7,630
121,688
251
3,297
650
1,249
5,908
46,239
Contractual
Principal
Outstanding
$ 2,371
10,823
9,673
121,092
n/a
3,035
1,271
n/a
5,909
55,854
Fair Value
Carrying
Amount Less
Unpaid
Principal
$(1,220)
(2,019)
(2,043)
596
n/a
262
(621)
n/a
(1)
(9,615)
2010
Fair Value
Carrying
Amount
$ 964
3,269
25,942
116,023
310
2,732
706
866
6,472
50,984
Contractual
Principal
Outstanding
$ 1,917
3,638
28,370
115,053
n/a
2,692
1,356
n/a
6,472
54,656
Fair Value
Carrying
Amount Less
Unpaid
Principal
$ (953)
(369)
(2,428)
970
n/a
40
(650)
n/a
—
(3,672)
(1) The majority of the difference between the fair value carrying amount and contractual principal outstanding at December 31, 2011 relates to the impact of widening of the Corporation’s credit spreads,
as well as the fair value of the embedded derivative, where applicable.
n/a = not applicable