Bank of America 2011 Annual Report Download - page 130
Download and view the complete annual report
Please find page 130 of the 2011 Bank of America annual report below. You can navigate through the pages in the report by either clicking on the pages listed below, or by using the keyword search tool below to find specific information within the annual report.-
 1
1 -
2
-
3
-
4
-
5
-
6
-
7
-
8
-
9
-
10
-
11
-
12
-
13
-
14
-
15
-
16
-
17
-
18
-
19
-
20
-
21
-
22
-
23
-
24
-
25
-
26
-
27
-
28
-
29
-
30
-
31
-
32
-
33
-
34
-
35
-
36
-
37
-
38
-
39
-
40
-
41
-
42
-
43
-
44
-
45
-
46
-
47
-
48
-
49
-
50
-
51
-
52
-
53
-
54
-
55
-
56
-
57
-
58
-
59
-
60
-
61
-
62
-
63
-
64
-
65
-
66
-
67
-
68
-
69
-
70
-
71
-
72
-
73
-
74
-
75
-
76
-
77
-
78
-
79
-
80
-
81
-
82
-
83
-
84
-
85
-
86
-
87
-
88
-
89
-
90
-
91
-
92
-
93
-
94
-
95
-
96
-
97
-
98
-
99
-
100
-
101
-
102
-
103
-
104
-
105
-
106
-
107
-
108
-
109
-
110
-
111
-
112
-
113
-
114
-
115
-
116
-
117
-
118
-
119
-
 120
120 -
 121
121 -
 122
122 -
 123
123 -
 124
124 -
 125
125 -
 126
126 -
 127
127 -
 128
128 -
 129
129 -
 130
130 -
 131
131 -
 132
132 -
 133
133 -
 134
134 -
 135
135 -
 136
136 -
 137
137 -
 138
138 -
 139
139 -
 140
140 -
141
-
142
-
143
-
144
-
145
-
146
-
147
-
148
-
149
-
150
-
151
-
152
-
153
-
154
-
155
-
156
-
157
-
158
-
159
-
160
-
161
-
162
-
163
-
164
-
165
-
166
-
167
-
168
-
169
-
170
-
171
-
172
-
173
-
174
-
175
-
176
-
177
-
178
-
179
-
180
-
181
-
182
-
183
-
184
-
185
-
186
-
187
-
188
-
189
-
190
-
191
-
192
-
193
-
194
-
195
-
196
-
197
-
198
-
199
-
200
-
201
-
202
-
203
-
204
-
205
-
206
-
207
-
208
-
209
-
210
-
211
-
212
-
213
-
214
-
215
-
216
-
217
-
218
-
219
-
220
-
221
-
222
-
223
-
224
-
225
-
226
-
227
-
228
-
229
-
230
-
231
-
232
-
233
-
234
-
235
-
236
-
237
-
238
-
239
-
240
-
241
-
242
-
243
-
244
-
245
-
246
-
247
-
248
-
249
-
250
-
251
-
252
-
253
-
254
-
255
-
256
-
257
-
258
-
259
-
260
-
261
-
262
-
263
-
264
-
265
-
266
-
267
-
268
-
269
-
270
-
271
-
272
-
273
-
274
-
275
-
276
 |
 |

128 Bank of America 2011
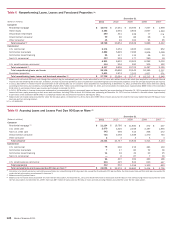
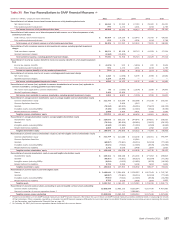
Table V Nonperforming Loans, Leases and Foreclosed Properties (1)
(Dollars in millions)
Consumer
Residential mortgage
Home equity
Discontinued real estate
Direct/Indirect consumer
Other consumer
Total consumer (2)
Commercial
U.S. commercial
Commercial real estate
Commercial lease financing
Non-U.S. commercial
U.S. small business commercial
Total commercial (3)
Total nonperforming loans and leases
Foreclosed properties
Total nonperforming loans, leases and foreclosed properties (4)
December 31
2011
$ 15,970
2,453
290
40
15
18,768
2,174
3,880
26
143
6,223
114
6,337
25,105
2,603
$ 27,708
2010
$ 17,691
2,694
331
90
48
20,854
3,453
5,829
117
233
9,632
204
9,836
30,690
1,974
$ 32,664
2009
$ 16,596
3,804
249
86
104
20,839
4,925
7,286
115
177
12,503
200
12,703
33,542
2,205
$ 35,747
2008
$ 7,057
2,637
77
26
91
9,888
2,040
3,906
56
290
6,292
205
6,497
16,385
1,827
$ 18,212
2007
$ 1,999
1,340
n/a
8
95
3,442
852
1,099
33
19
2,003
152
2,155
5,597
351
$ 5,948
(1) Balances do not include PCI loans even though the customer may be contractually past due. Loans accounted for as PCI loans were written down to fair value upon acquisition and accrete interest
income over the remaining life of the loan. In addition, the fully insured loan portfolio is also excluded from nonperforming loans and foreclosed properties since the principal repayments are insured.
(2) In 2011, $2.6 billion in interest income was estimated to be contractually due on consumer loans classified as nonperforming at December 31, 2011 provided that these loans had been paying
according to their terms and conditions, including TDRs of which $15.7 billion were performing at December 31, 2011 and not included in the table above. Approximately $985 million of the estimated
$2.6 billion in contractual interest was received and included in earnings for 2011.
(3) In 2011, $379 million in interest income was estimated to be contractually due on commercial loans and leases classified as nonperforming at December 31, 2011 provided that these loans and
leases had been paying according to their terms and conditions, including TDRs of which $1.8 billion were performing at December 31, 2011 and not included in the table above. Approximately
$123 million of the estimated $379 million in contractual interest was received and included in earnings for 2011.
(4) Balances do not include loans accounted for under the fair value option. At December 31, 2011, there were $786 million of loans accounted for under the fair value option that were 90 days or more
past due and not accruing interest.
n/a = not applicable
Table VI Accruing Loans and Leases Past Due 90 Days or More (1)
(Dollars in millions)
Consumer
Residential mortgage (2)
U.S. credit card
Non-U.S. credit card
Direct/Indirect consumer
Other consumer
Total consumer
Commercial
U.S. commercial
Commercial real estate
Commercial lease financing
Non-U.S. commercial
U.S. small business commercial
Total commercial
Total accruing loans and leases past due 90 days or more (3)
December 31
2011
$ 21,164
2,070
342
746
2
24,324
75
7
14
—
96
216
312
$ 24,636
2010
$ 16,768
3,320
599
1,058
2
21,747
236
47
18
6
307
325
632
$ 22,379
2009
$ 11,680
2,158
515
1,488
3
15,844
213
80
32
67
392
624
1,016
$ 16,860
2008
$ 372
2,197
368
1,370
4
4,311
381
52
23
7
463
640
1,103
$ 5,414
2007
$ 237
1,855
272
745
4
3,113
119
36
25
16
196
427
623
$ 3,736
(1) Our policy is to classify consumer real estate-secured loans as nonperforming at 90 days past due, except the Countrywide PCI loan portfolio, the fully-insured loan portfolio and loans accounted for
under the fair value option as referenced in footnote 3.
(2) Balances are fully-insured loans.
(3) Balances do not include loans accounted for under the fair value option. At December 31, 2011 and 2010 there were no loans past due 90 days or more still accruing interest accounted for under
the fair value option. At December 31, 2009, there was $87 million of loans past due 90 days or more and still accruing interest accounted for under the fair value option.