Bank of America 2011 Annual Report Download - page 200
Download and view the complete annual report
Please find page 200 of the 2011 Bank of America annual report below. You can navigate through the pages in the report by either clicking on the pages listed below, or by using the keyword search tool below to find specific information within the annual report.-
 1
1 -
2
-
3
-
4
-
5
-
6
-
7
-
8
-
9
-
10
-
11
-
12
-
13
-
14
-
15
-
16
-
17
-
18
-
19
-
20
-
21
-
22
-
23
-
24
-
25
-
26
-
27
-
28
-
29
-
30
-
31
-
32
-
33
-
34
-
35
-
36
-
37
-
38
-
39
-
40
-
41
-
42
-
43
-
44
-
45
-
46
-
47
-
48
-
49
-
50
-
51
-
52
-
53
-
54
-
55
-
56
-
57
-
58
-
59
-
60
-
61
-
62
-
63
-
64
-
65
-
66
-
67
-
68
-
69
-
70
-
71
-
72
-
73
-
74
-
75
-
76
-
77
-
78
-
79
-
80
-
81
-
82
-
83
-
84
-
85
-
86
-
87
-
88
-
89
-
90
-
91
-
92
-
93
-
94
-
95
-
96
-
97
-
98
-
99
-
100
-
101
-
102
-
103
-
104
-
105
-
106
-
107
-
108
-
109
-
110
-
111
-
112
-
113
-
114
-
115
-
116
-
117
-
118
-
119
-
120
-
121
-
122
-
123
-
124
-
125
-
126
-
127
-
128
-
129
-
130
-
131
-
132
-
133
-
134
-
135
-
136
-
137
-
138
-
139
-
140
-
141
-
142
-
143
-
144
-
145
-
146
-
147
-
148
-
149
-
150
-
151
-
152
-
153
-
154
-
155
-
156
-
157
-
158
-
159
-
160
-
161
-
162
-
163
-
164
-
165
-
166
-
167
-
168
-
169
-
170
-
171
-
172
-
173
-
174
-
175
-
176
-
177
-
178
-
179
-
180
-
181
-
182
-
183
-
184
-
185
-
186
-
187
-
188
-
189
-
 190
190 -
 191
191 -
 192
192 -
 193
193 -
 194
194 -
 195
195 -
 196
196 -
 197
197 -
 198
198 -
 199
199 -
 200
200 -
 201
201 -
 202
202 -
 203
203 -
 204
204 -
 205
205 -
 206
206 -
 207
207 -
 208
208 -
 209
209 -
 210
210 -
211
-
212
-
213
-
214
-
215
-
216
-
217
-
218
-
219
-
220
-
221
-
222
-
223
-
224
-
225
-
226
-
227
-
228
-
229
-
230
-
231
-
232
-
233
-
234
-
235
-
236
-
237
-
238
-
239
-
240
-
241
-
242
-
243
-
244
-
245
-
246
-
247
-
248
-
249
-
250
-
251
-
252
-
253
-
254
-
255
-
256
-
257
-
258
-
259
-
260
-
261
-
262
-
263
-
264
-
265
-
266
-
267
-
268
-
269
-
270
-
271
-
272
-
273
-
274
-
275
-
276
 |
 |

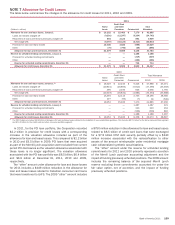
198 Bank of America 2011
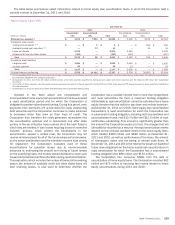
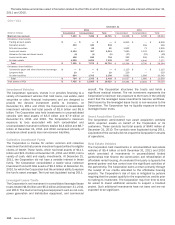
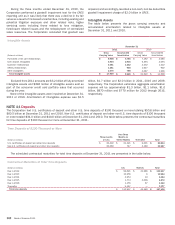
The table below summarizes select information related to other VIEs in which the Corporation held a variable interest at December 31,
2011 and 2010.
Other VIEs
(Dollars in millions)
Maximum loss exposure
On-balance sheet assets
Trading account assets
Derivative assets
AFS debt securities
Loans and leases
Allowance for loan and lease losses
Loans held-for-sale
All other assets
Total
On-balance sheet liabilities
Commercial paper and other short-term borrowings
Long-term debt
All other liabilities
Total
Total assets of VIEs
December 31
2011
Consolidated
$ 7,429
$—
394
—
5,154
(8)
106
1,809
$ 7,455
$—
10
694
$ 704
$ 7,455
Unconsolidated
$ 7,286
$—
440
62
357
(1)
598
5,823
$ 7,279
$—
—
1,705
$ 1,705
$ 11,055
Total
$ 14,715
$—
834
62
5,511
(9)
704
7,632
$ 14,734
$—
10
2,399
$ 2,409
$ 18,510
2010
Consolidated
$ 19,248
$ 8,900
—
1,832
7,690
(27)
262
937
$ 19,594
$ 1,115
229
8,683
$ 10,027
$ 19,594
Unconsolidated
$ 8,796
$—
228
73
1,122
(22)
949
6,440
$ 8,790
$—
—
1,666
$ 1,666
$ 13,416
Total
$ 28,044
$ 8,900
228
1,905
8,812
(49)
1,211
7,377
$ 28,384
$ 1,115
229
10,349
$11,693
$ 33,010
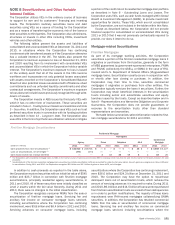
Investment Vehicles
The Corporation sponsors, invests in or provides financing to a
variety of investment vehicles that hold loans, real estate, debt
securities or other financial instruments and are designed to
provide the desired investment profile to investors. At
December 31, 2011 and 2010, the Corporation’s consolidated
investment vehicles had total assets of $2.6 billion and $5.6
billion. The Corporation also held investments in unconsolidated
vehicles with total assets of $5.5 billion and $7.9 billion at
December 31, 2011 and 2010. The Corporation’s maximum
exposure to loss associated with both consolidated and
unconsolidated investment vehicles totaled $4.4 billion and $8.7
billion at December 31, 2011 and 2010 comprised primarily of
on-balance sheet assets less non-recourse liabilities.
Collective Investment Funds
The Corporation is trustee for certain common and collective
investment funds that provide investment opportunities for eligible
clients of GWIM. These funds, which had total assets of $11.1
billion and $21.2 billion at December 31, 2011 and 2010, hold a
variety of cash, debt and equity investments. At December 31,
2011, the Corporation did not have a variable interest in these
funds. The Corporation consolidated a stable value collective
investment fund with total assets of $8.1 billion at December 31,
2010, for which the Corporation had the unilateral ability to replace
the fund’s asset manager. The fund was liquidated during 2011.
Leveraged Lease Trusts
The Corporation’s net investment in consolidated leveraged lease
trusts totaled $4.8 billion and $5.2 billion at December 31, 2011
and 2010. The trusts hold long-lived equipment such as rail cars,
power generation and distribution equipment, and commercial
aircraft. The Corporation structures the trusts and holds a
significant residual interest. The net investment represents the
Corporation’s maximum loss exposure to the trusts in the unlikely
event that the leveraged lease investments become worthless.
Debt issued by the leveraged lease trusts is non-recourse to the
Corporation. The Corporation has no liquidity exposure to these
leveraged lease trusts.
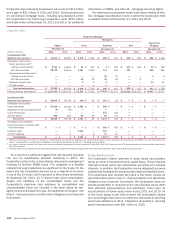
Asset Acquisition Conduits
The Corporation administered two asset acquisition conduits
which acquired assets on behalf of the Corporation or its
customers. These conduits had total assets of $640 million at
December 31, 2010. The conduits were liquidated during 2011.
Liquidation of the conduits did not impact the Corporation’s results
of operations.
Real Estate Vehicles
The Corporation held investments in unconsolidated real estate
vehicles of $5.4 billion at both December 31, 2011 and 2010
which consisted of investments in unconsolidated limited
partnerships that finance the construction and rehabilitation of
affordable rental housing. An unrelated third party is typically the
general partner and has control over the significant activities of
the partnership. The Corporation earns a return primarily through
the receipt of tax credits allocated to the affordable housing
projects. The Corporation’s risk of loss is mitigated by policies
requiring that the project qualify for the expected tax credits prior
to making its investment. The Corporation may from time to time
be asked to invest additional amounts to support a troubled
project. Such additional investments have not been and are not
expected to be significant.