Bank of America 2011 Annual Report Download - page 8
Download and view the complete annual report
Please find page 8 of the 2011 Bank of America annual report below. You can navigate through the pages in the report by either clicking on the pages listed below, or by using the keyword search tool below to find specific information within the annual report.-
 1
1 -
 2
2 -
 3
3 -
 4
4 -
 5
5 -
 6
6 -
 7
7 -
 8
8 -
 9
9 -
 10
10 -
 11
11 -
 12
12 -
 13
13 -
 14
14 -
 15
15 -
 16
16 -
 17
17 -
 18
18 -
 19
19 -
20
-
21
-
22
-
23
-
24
-
25
-
26
-
27
-
28
-
29
-
30
-
31
-
32
-
33
-
34
-
35
-
36
-
37
-
38
-
39
-
40
-
41
-
42
-
43
-
44
-
45
-
46
-
47
-
48
-
49
-
50
-
51
-
52
-
53
-
54
-
55
-
56
-
57
-
58
-
59
-
60
-
61
-
62
-
63
-
64
-
65
-
66
-
67
-
68
-
69
-
70
-
71
-
72
-
73
-
74
-
75
-
76
-
77
-
78
-
79
-
80
-
81
-
82
-
83
-
84
-
85
-
86
-
87
-
88
-
89
-
90
-
91
-
92
-
93
-
94
-
95
-
96
-
97
-
98
-
99
-
100
-
101
-
102
-
103
-
104
-
105
-
106
-
107
-
108
-
109
-
110
-
111
-
112
-
113
-
114
-
115
-
116
-
117
-
118
-
119
-
120
-
121
-
122
-
123
-
124
-
125
-
126
-
127
-
128
-
129
-
130
-
131
-
132
-
133
-
134
-
135
-
136
-
137
-
138
-
139
-
140
-
141
-
142
-
143
-
144
-
145
-
146
-
147
-
148
-
149
-
150
-
151
-
152
-
153
-
154
-
155
-
156
-
157
-
158
-
159
-
160
-
161
-
162
-
163
-
164
-
165
-
166
-
167
-
168
-
169
-
170
-
171
-
172
-
173
-
174
-
175
-
176
-
177
-
178
-
179
-
180
-
181
-
182
-
183
-
184
-
185
-
186
-
187
-
188
-
189
-
190
-
191
-
192
-
193
-
194
-
195
-
196
-
197
-
198
-
199
-
200
-
201
-
202
-
203
-
204
-
205
-
206
-
207
-
208
-
209
-
210
-
211
-
212
-
213
-
214
-
215
-
216
-
217
-
218
-
219
-
220
-
221
-
222
-
223
-
224
-
225
-
226
-
227
-
228
-
229
-
230
-
231
-
232
-
233
-
234
-
235
-
236
-
237
-
238
-
239
-
240
-
241
-
242
-
243
-
244
-
245
-
246
-
247
-
248
-
249
-
250
-
251
-
252
-
253
-
254
-
255
-
256
-
257
-
258
-
259
-
260
-
261
-
262
-
263
-
264
-
265
-
266
-
267
-
268
-
269
-
270
-
271
-
272
-
273
-
274
-
275
-
276
 |
 |
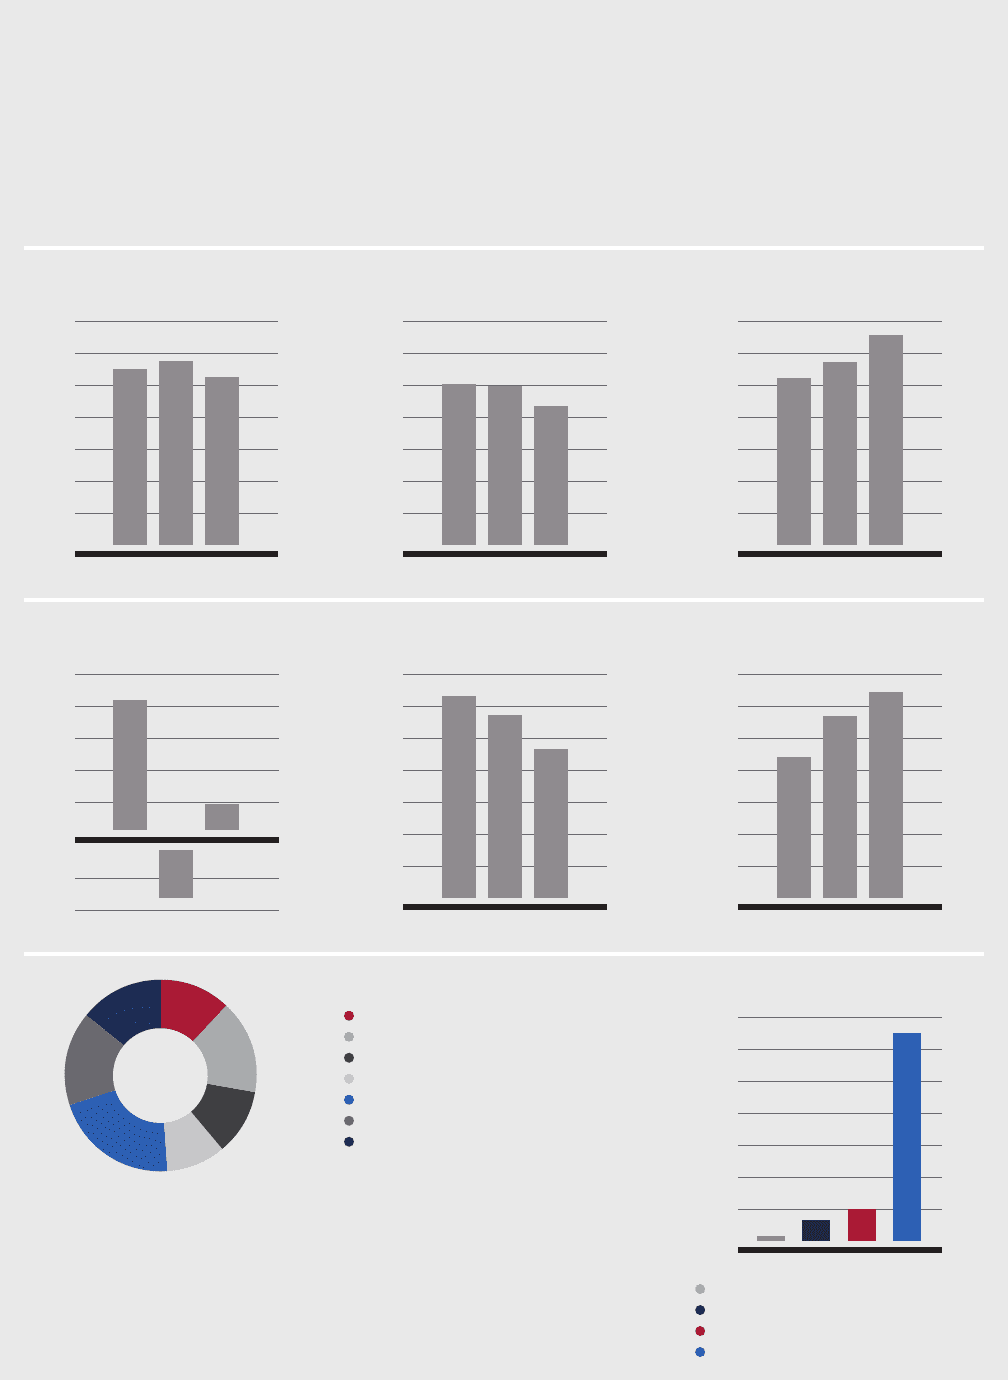
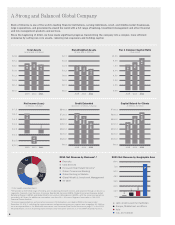
Tier 1 Common Capital Ratio
(at year-end)
0.0%
1.5%
3.0%
4.5%
6.0%
7.5%
9.0%
10.5%
201120102009
7.8 %
8.6%
9.9%
Bank of America is one of the world’s leading financial institutions, serving individuals, small- and middle-market businesses,
large corporations, and governments around the world with a full range of banking, investment management and other financial
and risk management products and services.
Since the beginning of 2010, we have made significant progress transforming the company into a simpler, more efficient
enterprise by selling non-core assets, reducing risk exposures and building capital.
A Strong and Balanced Global Company
2011 Net Revenue by Business1,2
Deposits
Card Services
Consumer Real Estate Services3
Global Commercial Banking
Global Banking & Markets
Global Wealth & Investment Management
All Other
Latin America and the Caribbean
Europe, Middle East and Africa
Asia
U.S. and Canada
1 Fully taxable-equivalent basis
2 We provide a diversified range of banking and non-banking financial services and products through six business
segments: Deposits, Card Services, Consumer Real Estate Services (CRES), Global Commercial Banking, Global
Banking & Markets (GBAM) and Global Wealth & Investment Management (GWIM), with the remaining operations
recorded in All Other. For additional information, see Note 26 — Business Segment Information in the 2011
Financial Review Section.
3 Excludes representations and warranties provision of $15.6 billion, recorded in CRES for the year ended
December 31, 2011. Including the representations and warranties provision, revenue was a negative $3.2 billion
on an as-reported basis. For additional information, see Consumer Real Estate Services on page 37 in the 2011
Financial Review section. Excluding representations and warranties provision is a non-GAAP financial measure.
16%
14%
16%
11%
12%
10%
21%
Total Assets
(at year-end, in trillions)
$0.0
$0.4
$0.8
$1.2
$1.6
$2.0
$2.4
$2.8
$2.2
$2.3
$2.1
201120102009
Risk-Weighted Assets
(at year-end, in trillions)
$0.0
$0.3
$0.6
$0.9
$1.2
$1.5
$1.8
$2.1
$1.5
$1.5
$1.3
201120102009
$(3.0)
$(1.5)
$0.0
$1.5
$3.0
$4.5
$6.0
$7.5
$6.3
$(2.2)
$1.4
201120102009
Net Income (Loss)
(in billions, full year)
$0.0
$120.0
$240.0
$360.0
$480.0
$600.0
$720.0
$840.0
201120102009
$756.1
$685.3
$557.3
Credit Extended
(domestic, in billions, full year)
$0.0
$100.0
$200.0
$300.0
$400.0
$500.0
$600.0
$700.0
201120102009
$441.5
$569.3
$644.5
Capital Raised for Clients
(in billions, full year)
2011 Net Revenue by Geographic Area
0%
12%
24%
36%
48%
60%
72%
84%
2%
8%
12%
78%
6