Bank of America 2011 Annual Report Download - page 117
Download and view the complete annual report
Please find page 117 of the 2011 Bank of America annual report below. You can navigate through the pages in the report by either clicking on the pages listed below, or by using the keyword search tool below to find specific information within the annual report.-
 1
1 -
2
-
3
-
4
-
5
-
6
-
7
-
8
-
9
-
10
-
11
-
12
-
13
-
14
-
15
-
16
-
17
-
18
-
19
-
20
-
21
-
22
-
23
-
24
-
25
-
26
-
27
-
28
-
29
-
30
-
31
-
32
-
33
-
34
-
35
-
36
-
37
-
38
-
39
-
40
-
41
-
42
-
43
-
44
-
45
-
46
-
47
-
48
-
49
-
50
-
51
-
52
-
53
-
54
-
55
-
56
-
57
-
58
-
59
-
60
-
61
-
62
-
63
-
64
-
65
-
66
-
67
-
68
-
69
-
70
-
71
-
72
-
73
-
74
-
75
-
76
-
77
-
78
-
79
-
80
-
81
-
82
-
83
-
84
-
85
-
86
-
87
-
88
-
89
-
90
-
91
-
92
-
93
-
94
-
95
-
96
-
97
-
98
-
99
-
100
-
101
-
102
-
103
-
104
-
105
-
106
-
 107
107 -
 108
108 -
 109
109 -
 110
110 -
 111
111 -
 112
112 -
 113
113 -
 114
114 -
 115
115 -
 116
116 -
 117
117 -
 118
118 -
 119
119 -
 120
120 -
 121
121 -
 122
122 -
 123
123 -
 124
124 -
 125
125 -
 126
126 -
 127
127 -
128
-
129
-
130
-
131
-
132
-
133
-
134
-
135
-
136
-
137
-
138
-
139
-
140
-
141
-
142
-
143
-
144
-
145
-
146
-
147
-
148
-
149
-
150
-
151
-
152
-
153
-
154
-
155
-
156
-
157
-
158
-
159
-
160
-
161
-
162
-
163
-
164
-
165
-
166
-
167
-
168
-
169
-
170
-
171
-
172
-
173
-
174
-
175
-
176
-
177
-
178
-
179
-
180
-
181
-
182
-
183
-
184
-
185
-
186
-
187
-
188
-
189
-
190
-
191
-
192
-
193
-
194
-
195
-
196
-
197
-
198
-
199
-
200
-
201
-
202
-
203
-
204
-
205
-
206
-
207
-
208
-
209
-
210
-
211
-
212
-
213
-
214
-
215
-
216
-
217
-
218
-
219
-
220
-
221
-
222
-
223
-
224
-
225
-
226
-
227
-
228
-
229
-
230
-
231
-
232
-
233
-
234
-
235
-
236
-
237
-
238
-
239
-
240
-
241
-
242
-
243
-
244
-
245
-
246
-
247
-
248
-
249
-
250
-
251
-
252
-
253
-
254
-
255
-
256
-
257
-
258
-
259
-
260
-
261
-
262
-
263
-
264
-
265
-
266
-
267
-
268
-
269
-
270
-
271
-
272
-
273
-
274
-
275
-
276
 |
 |
Bank of America 2011 115
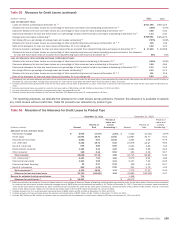
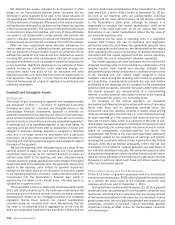
consumer and commercial loans and leases, adjustments made
to address current events and conditions, considerations
regarding domestic and global economic uncertainty, and overall
credit conditions.
Our estimate for the allowance for loan and lease losses is
sensitive to the loss rates and expected cash flows from our home
loans, and credit card and other consumer portfolio segments. For
each one percent increase in the loss rates on loans collectively
evaluated for impairment in our home loans portfolio segment,
excluding PCI loans, coupled with a one percent decrease in the
discounted cash flows on those loans individually evaluated for
impairment within this portfolio segment, the allowance for loan
and lease losses at December 31, 2011 would have increased by
$156 million. PCI loans within our home loans portfolio segment
are initially recorded at fair value. Applicable accounting guidance
prohibits carry-over or creation of valuation allowances in the initial
accounting. However, subsequent decreases in the expected cash
flows from the date of acquisition result in a charge to the provision
for credit losses and a corresponding increase to the allowance
for loan and lease losses. We subject our PCI portfolio to stress
scenarios to evaluate the potential impact given certain events.
A one percent decrease in the expected cash flows could result
in a $241 million impairment of the portfolio, of which $115 million
would be related to our discontinued real estate portfolio. For each
one percent increase in the loss rates on loans collectively
evaluated for impairment within our credit card and other consumer
portfolio segment coupled with a one percent decrease in the
expected cash flows on those loans individually evaluated for
impairment within this portfolio segment, the allowance for loan
and lease losses at December 31, 2011 would have increased by
$84 million.
Our allowance for loan and lease losses is sensitive to the risk
ratings assigned to loans and leases within our commercial
portfolio segment. Assuming a downgrade of one level in the
internal risk ratings for commercial loans and leases, except loans
and leases already risk-rated Doubtful as defined by regulatory
authorities, the allowance for loan and lease losses would have
increased by $3.1 billion at December 31, 2011.
The allowance for loan and lease losses as a percentage of
total loans and leases at December 31, 2011 was 3.68 percent
and these hypothetical increases in the allowance would raise the
ratio to 4.00 percent.
These sensitivity analyses do not represent management’s
expectations of the deterioration in risk ratings or the increases
in loss rates but are provided as hypothetical scenarios to assess
the sensitivity of the allowance for loan and lease losses to
changes in key inputs. We believe the risk ratings and loss
severities currently in use are appropriate and that the probability
of the alternative scenarios outlined above occurring within a short
period of time is remote.
The process of determining the level of the allowance for credit
losses requires a high degree of judgment. It is possible that
others, given the same information, may at any point in time reach
different reasonable conclusions.
Mortgage Servicing Rights
MSRs are nonfinancial assets that are created when a mortgage
loan is sold and we retain the right to service the loan. We account
for consumer MSRs at fair value with changes in fair value recorded
in the Consolidated Statement of Income in mortgage banking
income. Commercial-related and residential reverse mortgage
MSRs are accounted for using the amortization method, lower of
amortized cost or fair value, with impairment recognized as a
reduction of mortgage banking income. At December 31, 2011,
our total MSR balance was $7.5 billion.
We determine the fair value of our consumer MSRs using a
valuation model that calculates the present value of estimated
future net servicing income. The model incorporates key economic
assumptions including estimates of prepayment rates and
resultant weighted-average lives of the MSRs, and the option-
adjusted spread levels. These variables can, and generally do,
change from quarter to quarter as market conditions and projected
interest rates change. These assumptions are subjective in nature
and changes in these assumptions could materially affect our
operating results. For example, decreasing the prepayment rate
assumption used in the valuation of our consumer MSRs by
10 percent while keeping all other assumptions unchanged could
have resulted in an estimated increase of $639 million in MSRs
and mortgage banking income at December 31, 2011. This impact
does not reflect any hedge strategies that may be undertaken to
mitigate such risk.
We manage potential changes in the fair value of MSRs through
a comprehensive risk management program. The intent is to
mitigate the effects of changes in the fair value of MSRs through
the use of risk management instruments. To reduce the sensitivity
of earnings to interest rate and market value fluctuations,
securities as well as certain derivatives such as options and
interest rate swaps may be used as economic hedges of the MSRs,
but are not designated as accounting hedges. These instruments
are carried at fair value with changes in fair value recognized in
mortgage banking income. For more information, see Mortgage
Banking Risk Management on page 113.
For additional information on MSRs, including the sensitivity of
weighted-average lives and the fair value of MSRs to changes in
modeled assumptions, see Note 25 – Mortgage Servicing Rights
to the Consolidated Financial Statements.
Fair Value of Financial Instruments
We determine the fair values of financial instruments based on
the fair value hierarchy under applicable accounting guidance
which requires an entity to maximize the use of observable inputs
and minimize the use of unobservable inputs when measuring fair
value. Applicable accounting guidance establishes three levels of
inputs used to measure fair value. We carry trading account assets
and liabilities, derivative assets and liabilities, AFS debt and
marketable equity securities, certain MSRs and certain other
assets at fair value. Also, we account for certain corporate loans
and loan commitments, LHFS, other short-term borrowings,
securities financing agreements, asset-backed secured
financings, long-term deposits and long-term debt under the fair
value option. For more information, see Note 22 – Fair Value
Measurements and Note 23 – Fair Value Option to the Consolidated
Financial Statements.
The fair values of assets and liabilities include adjustments for
market liquidity, credit quality and other deal specific factors, where
appropriate. Valuations of products using models or other
techniques are sensitive to assumptions used for the significant
inputs. Where market data is available, the inputs used for
valuation reflect that information as of our valuation date. Inputs
to valuation models are considered unobservable if they are
supported by little or no market activity. In periods of extreme
volatility, lessened liquidity or in illiquid markets, there may be