Bank of America 2011 Annual Report Download - page 113
Download and view the complete annual report
Please find page 113 of the 2011 Bank of America annual report below. You can navigate through the pages in the report by either clicking on the pages listed below, or by using the keyword search tool below to find specific information within the annual report.-
 1
1 -
2
-
3
-
4
-
5
-
6
-
7
-
8
-
9
-
10
-
11
-
12
-
13
-
14
-
15
-
16
-
17
-
18
-
19
-
20
-
21
-
22
-
23
-
24
-
25
-
26
-
27
-
28
-
29
-
30
-
31
-
32
-
33
-
34
-
35
-
36
-
37
-
38
-
39
-
40
-
41
-
42
-
43
-
44
-
45
-
46
-
47
-
48
-
49
-
50
-
51
-
52
-
53
-
54
-
55
-
56
-
57
-
58
-
59
-
60
-
61
-
62
-
63
-
64
-
65
-
66
-
67
-
68
-
69
-
70
-
71
-
72
-
73
-
74
-
75
-
76
-
77
-
78
-
79
-
80
-
81
-
82
-
83
-
84
-
85
-
86
-
87
-
88
-
89
-
90
-
91
-
92
-
93
-
94
-
95
-
96
-
97
-
98
-
99
-
100
-
101
-
102
-
 103
103 -
 104
104 -
 105
105 -
 106
106 -
 107
107 -
 108
108 -
 109
109 -
 110
110 -
 111
111 -
 112
112 -
 113
113 -
 114
114 -
 115
115 -
 116
116 -
 117
117 -
 118
118 -
 119
119 -
 120
120 -
 121
121 -
 122
122 -
 123
123 -
124
-
125
-
126
-
127
-
128
-
129
-
130
-
131
-
132
-
133
-
134
-
135
-
136
-
137
-
138
-
139
-
140
-
141
-
142
-
143
-
144
-
145
-
146
-
147
-
148
-
149
-
150
-
151
-
152
-
153
-
154
-
155
-
156
-
157
-
158
-
159
-
160
-
161
-
162
-
163
-
164
-
165
-
166
-
167
-
168
-
169
-
170
-
171
-
172
-
173
-
174
-
175
-
176
-
177
-
178
-
179
-
180
-
181
-
182
-
183
-
184
-
185
-
186
-
187
-
188
-
189
-
190
-
191
-
192
-
193
-
194
-
195
-
196
-
197
-
198
-
199
-
200
-
201
-
202
-
203
-
204
-
205
-
206
-
207
-
208
-
209
-
210
-
211
-
212
-
213
-
214
-
215
-
216
-
217
-
218
-
219
-
220
-
221
-
222
-
223
-
224
-
225
-
226
-
227
-
228
-
229
-
230
-
231
-
232
-
233
-
234
-
235
-
236
-
237
-
238
-
239
-
240
-
241
-
242
-
243
-
244
-
245
-
246
-
247
-
248
-
249
-
250
-
251
-
252
-
253
-
254
-
255
-
256
-
257
-
258
-
259
-
260
-
261
-
262
-
263
-
264
-
265
-
266
-
267
-
268
-
269
-
270
-
271
-
272
-
273
-
274
-
275
-
276
 |
 |
Bank of America 2011 111
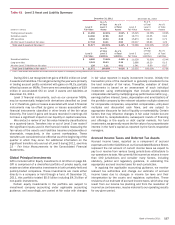
The sensitivity analysis in Table 59 assumes that we take no
action in response to these rate shifts over the indicated periods.
Our core net interest income was asset sensitive to a parallel move
in interest rates at both December 31, 2011 and 2010. As part
of our ALM activities, we use securities, residential mortgages,
and interest rate and foreign exchange derivatives in managing
interest rate sensitivity. The significant decline in long-end rates
contributed to the increase in asset sensitivity between 2011 and
2010.
Securities
The securities portfolio is an integral part of our ALM position and
is primarily comprised of debt securities including MBS and to a
lesser extent U.S. Treasury, corporate, municipal and other debt
securities. At December 31, 2011 and 2010, we held AFS debt
securities of $276.2 billion and $337.6 billion. During 2011 and
2010, we purchased AFS debt securities of $99.5 billion and
$199.2 billion, sold $116.8 billion and $97.5 billion, and had
maturities and received paydowns of $56.7 billion and $70.9
billion. We realized $3.4 billion and $2.5 billion in net gains on
sales of debt securities during 2011 and 2010. We securitized no
mortgage loans into MBS during 2011 compared to $2.4 billion
in 2010, which we retained.
During 2011, we purchased approximately $35.6 billion of U.S.
agency MBS which are classified as held-to-maturity securities.
The purchases of these securities are part of our long-term
investment activities which include holding these securities to
maturity. The classification of these securities as held-to-maturity
also mitigates accumulated OCI volatility and possible negative
impacts on our regulatory capital requirements under the Basel III
capital standards. The contractual maturities of the held-to-
maturity securities are greater than 10 years and they are subject
to prepayment by the issuers.
Accumulated OCI included after-tax net unrealized gains of $3.1
billion and $7.4 billion at December 31, 2011 and 2010,
comprised primarily of after-tax net unrealized gains of $3.1 billion
and $714 million related to AFS debt securities and after-tax net
unrealized gains of $3 million and $6.7 billion related to AFS
marketable equity securities. The December 31, 2010 unrealized
gain on marketable equity securities was related to our investment
in CCB. See Note 5 – Securities to the Consolidated Financial
Statements for further discussion on marketable equity securities.
The net unrealized gains in accumulated OCI related to AFS debt
securities increased $3.9 billion during 2011 to $5.0 billion,
primarily due to a lower interest rate environment.
We recognized $299 million of other-than-temporary
impairment (OTTI) losses in earnings on AFS debt securities in
2011 compared to $970 million on AFS debt and marketable equity
securities in 2010. The recognition of OTTI losses on AFS debt
and marketable equity securities is based on a variety of factors,
including the length of time and extent to which the market value
has been less than amortized cost, the financial condition of the
issuer of the security including credit ratings and any specific
events affecting the operations of the issuer, underlying assets
that collateralize the debt security, other industry and
macroeconomic conditions, and our intent and ability to hold the
security to recovery.
Residential Mortgage Portfolio
At December 31, 2011 and 2010, our residential mortgage
portfolio was $262.3 billion (which excludes $906 million in
residential mortgage loans accounted for under the fair value
option) and $258.0 billion. For more information on consumer fair
value option loans, see Consumer Credit Risk – Consumer Loans
Accounted for Under the Fair Value Option on page 86. Outstanding
residential mortgage loans increased $4.3 billion in 2011 as new
origination volume was partially offset by paydowns, charge-offs
and transfers to foreclosed properties. In addition, we repurchased
$7.8 billion of delinquent FHA loans pursuant to our servicing
agreements with GNMA which also increased the residential
mortgage portfolio during 2011.
During 2011 and 2010, we retained $45.5 billion and
$63.8 billion in first-lien mortgages originated by CRES and GWIM.
We received paydowns of $42.3 billion and $38.2 billion in 2011
and 2010. There were no loans securitized in 2011 compared to
$2.4 billion of loans securitized into MBS which we retained in
2010. We recognized gains of $68 million on the securitizations
completed in 2010. We purchased $72 million of residential
mortgages related to ALM activities in 2011 compared to none in
2010. We sold $109 million and $443 million of residential
mortgages in 2011 and 2010, of which all of the 2011 sales were
originated residential mortgages and $432 million of the 2010
sales were originated residential mortgages and $11 million were
previously purchased from third parties. Net gains on these
transactions were minimal.
Interest Rate and Foreign Exchange Derivative
Contracts
Interest rate and foreign exchange derivative contracts are utilized
in our ALM activities and serve as an efficient tool to manage our
interest rate and foreign exchange risk. We use derivatives to
hedge the variability in cash flows or changes in fair value on our
balance sheet due to interest rate and foreign exchange
components. For additional information on our hedging activities,
see Note 4 – Derivatives to the Consolidated Financial Statements.
Our interest rate contracts are generally non-leveraged generic
interest rate and foreign exchange basis swaps, options, futures
and forwards. In addition, we use foreign exchange contracts,
including cross-currency interest rate swaps, foreign currency
forward contracts and options to mitigate the foreign exchange
risk associated with foreign currency-denominated assets and
liabilities.
Changes to the composition of our derivatives portfolio during
2011 reflect actions taken for interest rate and foreign exchange
rate risk management. The decisions to reposition our derivatives
portfolio are based upon the current assessment of economic and
financial conditions including the interest rate and foreign currency
environments, balance sheet composition and trends, and the
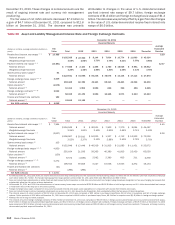
relative mix of our cash and derivative positions. Table 60 includes
derivatives utilized in our ALM activities including those designated
as accounting and economic hedging instruments and shows the
notional amount, fair value, weighted-average receive-fixed and
pay-fixed rates, expected maturity and average estimated
durations of our open ALM derivatives at December 31, 2011 and
2010. Our interest rate swap positions, including foreign exchange
contracts, were a net receive-fixed position of $67.9 billion and
$6.4 billion at December 31, 2011 and 2010. The notional amount
of our foreign exchange basis swaps was $262.4 billion and
$235.2 billion at December 31, 2011 and 2010. Our futures and
forwards notional position, which reflects the net of long and short
positions, was a long position of $12.2 billion at December 31,
2011 compared to a short position of $280 million at