Bank of America 2011 Annual Report Download - page 266
Download and view the complete annual report
Please find page 266 of the 2011 Bank of America annual report below. You can navigate through the pages in the report by either clicking on the pages listed below, or by using the keyword search tool below to find specific information within the annual report.-
 1
1 -
2
-
3
-
4
-
5
-
6
-
7
-
8
-
9
-
10
-
11
-
12
-
13
-
14
-
15
-
16
-
17
-
18
-
19
-
20
-
21
-
22
-
23
-
24
-
25
-
26
-
27
-
28
-
29
-
30
-
31
-
32
-
33
-
34
-
35
-
36
-
37
-
38
-
39
-
40
-
41
-
42
-
43
-
44
-
45
-
46
-
47
-
48
-
49
-
50
-
51
-
52
-
53
-
54
-
55
-
56
-
57
-
58
-
59
-
60
-
61
-
62
-
63
-
64
-
65
-
66
-
67
-
68
-
69
-
70
-
71
-
72
-
73
-
74
-
75
-
76
-
77
-
78
-
79
-
80
-
81
-
82
-
83
-
84
-
85
-
86
-
87
-
88
-
89
-
90
-
91
-
92
-
93
-
94
-
95
-
96
-
97
-
98
-
99
-
100
-
101
-
102
-
103
-
104
-
105
-
106
-
107
-
108
-
109
-
110
-
111
-
112
-
113
-
114
-
115
-
116
-
117
-
118
-
119
-
120
-
121
-
122
-
123
-
124
-
125
-
126
-
127
-
128
-
129
-
130
-
131
-
132
-
133
-
134
-
135
-
136
-
137
-
138
-
139
-
140
-
141
-
142
-
143
-
144
-
145
-
146
-
147
-
148
-
149
-
150
-
151
-
152
-
153
-
154
-
155
-
156
-
157
-
158
-
159
-
160
-
161
-
162
-
163
-
164
-
165
-
166
-
167
-
168
-
169
-
170
-
171
-
172
-
173
-
174
-
175
-
176
-
177
-
178
-
179
-
180
-
181
-
182
-
183
-
184
-
185
-
186
-
187
-
188
-
189
-
190
-
191
-
192
-
193
-
194
-
195
-
196
-
197
-
198
-
199
-
200
-
201
-
202
-
203
-
204
-
205
-
206
-
207
-
208
-
209
-
210
-
211
-
212
-
213
-
214
-
215
-
216
-
217
-
218
-
219
-
220
-
221
-
222
-
223
-
224
-
225
-
226
-
227
-
228
-
229
-
230
-
231
-
232
-
233
-
234
-
235
-
236
-
237
-
238
-
239
-
240
-
241
-
242
-
243
-
244
-
245
-
246
-
247
-
248
-
249
-
250
-
251
-
252
-
253
-
254
-
255
-
 256
256 -
 257
257 -
 258
258 -
 259
259 -
 260
260 -
 261
261 -
 262
262 -
 263
263 -
 264
264 -
 265
265 -
 266
266 -
 267
267 -
 268
268 -
 269
269 -
 270
270 -
 271
271 -
 272
272 -
 273
273 -
 274
274 -
 275
275 -
 276
276
 |
 |

264 Bank of America 2011
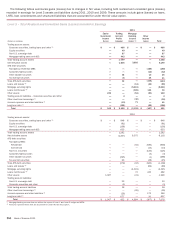
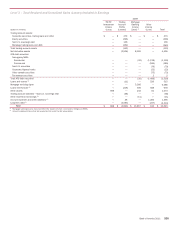
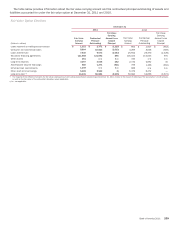
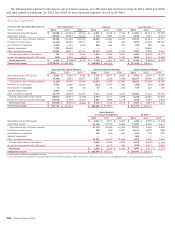
The following tables present total revenue, net of interest expense, on a FTE basis and net income (loss) for 2011, 2010 and 2009,
and total assets at December 31, 2011 and 2010 for each business segment, as well as All Other.
Business Segments
At and for the Year Ended December 31
(Dollars in millions)
Net interest income (FTE basis)
Noninterest income
Total revenue, net of interest expense
Provision for credit losses
Amortization of intangibles
Goodwill impairment
Other noninterest expense
Income (loss) before income taxes
Income tax expense (benefit) (FTE basis)
Net income (loss)
Year-end total assets
Net interest income (FTE basis)
Noninterest income
Total revenue, net of interest expense
Provision for credit losses
Amortization of intangibles
Goodwill impairment
Other noninterest expense
Income (loss) before income taxes
Income tax expense (benefit) (FTE basis)
Net income
Year-end total assets
Total Corporation (1)
2011
$ 45,588
48,838
94,426
13,410
1,509
3,184
75,581
742
(704)
$ 1,446
$ 2,129,046
Consumer Real Estate Services
2011
$ 3,207
(6,361)
(3,154)
4,524
11
2,603
19,279
(29,571)
(10,042)
$ (19,529)
$ 163,712
2010
$ 52,693
58,697
111,390
28,435
1,731
12,400
68,977
(153)
2,085
$ (2,238)
$2,264,909
2010
$ 4,662
5,667
10,329
8,490
38
2,000
12,848
(13,047)
(4,100)
$ (8,947)
$ 212,412
2009
$ 48,410
72,534
120,944
48,570
1,978
—
64,735
5,661
(615)
$ 6,276
2009
$ 4,961
11,677
16,638
11,244
63
—
11,437
(6,106)
(2,217)
$ (3,889)
Deposits
2011
$ 8,471
4,218
12,689
173
154
—
10,479
1,883
691
$ 1,192
$ 445,680
Global Commercial Banking
2011
$ 7,176
3,377
10,553
(634)
57
—
4,177
6,953
2,551
$ 4,402
$ 289,985
Global Wealth &
Investment Management
2011
$ 6,046
11,330
17,376
398
438
—
13,957
2,583
948
$ 1,635
$ 283,844
2010
$ 8,278
5,284
13,562
201
194
—
11,002
2,165
803
$ 1,362
$440,954
2010
$8,007
3,219
11,226
1,979
72
—
4,058
5,117
1,899
$ 3,218
$312,807
2010
$ 5,677
10,612
16,289
646
458
—
12,769
2,416
1,076
$ 1,340
$296,251
2009
$ 7,195
7,041
14,236
341
237
—
9,451
4,207
1,530
$ 2,677
2009
$ 8,022
7,438
15,460
7,782
100
—
4,120
3,458
1,279
$ 2,179
2009
$ 5,882
9,904
15,786
1,060
480
—
11,641
2,605
936
$ 1,669
Card Services (2)
2011
$11,507
6,636
18,143
3,072
599
—
5,425
9,047
3,259
$ 5,788
$ 127,636
Global Banking & Markets
2011
$ 7,401
16,217
23,618
(296)
116
—
18,063
5,735
2,768
$ 2,967
$ 637,754
All Other (2)
2011
$ 1,780
13,421
15,201
6,173
134
581
4,201
4,112
(879)
$ 4,991
$ 180,435
2010
$ 14,413
7,927
22,340
10,962
668
10,400
5,289
(4,979)
2,001
$ (6,980)
$138,491
2010
$ 8,000
19,949
27,949
(166)
123
—
17,412
10,580
4,283
$ 6,297
$653,737
2010
$ 3,656
6,039
9,695
6,323
178
—
5,599
(2,405)
(3,877)
$ 1,472
$210,257
2009
$ 16,502
8,275
24,777
26,351
746
—
5,857
(8,177)
(2,965)
$ (5,212)
2009
$ 9,557
18,624
28,181
1,998
129
—
15,135
10,919
3,246
$ 7,673
2009
$ (3,709)
9,575
5,866
(206)
223
—
7,094
(1,245)
(2,424)
$ 1,179
(1) There were no material intersegment revenues.
(2) 2011 and 2010 are presented in accordance with new consolidation guidance. 2009 Card Services results are presented on a managed basis with a corresponding offset recorded in All Other.