Bank of America 2011 Annual Report Download - page 43
Download and view the complete annual report
Please find page 43 of the 2011 Bank of America annual report below. You can navigate through the pages in the report by either clicking on the pages listed below, or by using the keyword search tool below to find specific information within the annual report.-
 1
1 -
2
-
3
-
4
-
5
-
6
-
7
-
8
-
9
-
10
-
11
-
12
-
13
-
14
-
15
-
16
-
17
-
18
-
19
-
20
-
21
-
22
-
23
-
24
-
25
-
26
-
27
-
28
-
29
-
30
-
31
-
32
-
 33
33 -
 34
34 -
 35
35 -
 36
36 -
 37
37 -
 38
38 -
 39
39 -
 40
40 -
 41
41 -
 42
42 -
 43
43 -
 44
44 -
 45
45 -
 46
46 -
 47
47 -
 48
48 -
 49
49 -
 50
50 -
 51
51 -
 52
52 -
 53
53 -
54
-
55
-
56
-
57
-
58
-
59
-
60
-
61
-
62
-
63
-
64
-
65
-
66
-
67
-
68
-
69
-
70
-
71
-
72
-
73
-
74
-
75
-
76
-
77
-
78
-
79
-
80
-
81
-
82
-
83
-
84
-
85
-
86
-
87
-
88
-
89
-
90
-
91
-
92
-
93
-
94
-
95
-
96
-
97
-
98
-
99
-
100
-
101
-
102
-
103
-
104
-
105
-
106
-
107
-
108
-
109
-
110
-
111
-
112
-
113
-
114
-
115
-
116
-
117
-
118
-
119
-
120
-
121
-
122
-
123
-
124
-
125
-
126
-
127
-
128
-
129
-
130
-
131
-
132
-
133
-
134
-
135
-
136
-
137
-
138
-
139
-
140
-
141
-
142
-
143
-
144
-
145
-
146
-
147
-
148
-
149
-
150
-
151
-
152
-
153
-
154
-
155
-
156
-
157
-
158
-
159
-
160
-
161
-
162
-
163
-
164
-
165
-
166
-
167
-
168
-
169
-
170
-
171
-
172
-
173
-
174
-
175
-
176
-
177
-
178
-
179
-
180
-
181
-
182
-
183
-
184
-
185
-
186
-
187
-
188
-
189
-
190
-
191
-
192
-
193
-
194
-
195
-
196
-
197
-
198
-
199
-
200
-
201
-
202
-
203
-
204
-
205
-
206
-
207
-
208
-
209
-
210
-
211
-
212
-
213
-
214
-
215
-
216
-
217
-
218
-
219
-
220
-
221
-
222
-
223
-
224
-
225
-
226
-
227
-
228
-
229
-
230
-
231
-
232
-
233
-
234
-
235
-
236
-
237
-
238
-
239
-
240
-
241
-
242
-
243
-
244
-
245
-
246
-
247
-
248
-
249
-
250
-
251
-
252
-
253
-
254
-
255
-
256
-
257
-
258
-
259
-
260
-
261
-
262
-
263
-
264
-
265
-
266
-
267
-
268
-
269
-
270
-
271
-
272
-
273
-
274
-
275
-
276
 |
 |

Bank of America 2011 41
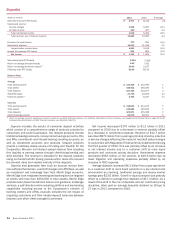
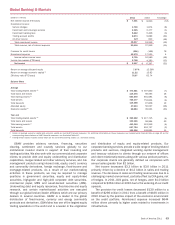
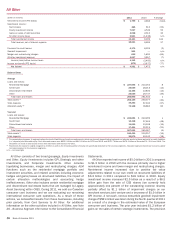
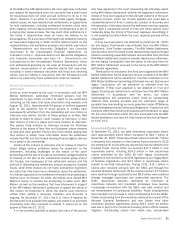
Global Commercial Banking
(Dollars in millions)
Net interest income (FTE basis)
Noninterest income:
Service charges
All other income
Total noninterest income
Total revenue, net of interest expense
Provision for credit losses
Noninterest expense
Income before income taxes
Income tax expense (FTE basis)
Net income
Net interest yield (FTE basis)
Return on average allocated equity
Return on average economic capital (1)
Efficiency ratio (FTE basis)
Balance Sheet
Average
Total loans and leases
Total earning assets
Total assets
Total deposits
Allocated equity
Economic capital (1)
Year end
Total loans and leases
Total earning assets
Total assets
Total deposits
2011
$ 7,176
2,264
1,113
3,377
10,553
(634)
4,234
6,953
2,551
$ 4,402
2.65%
10.77
21.83
40.12
$ 189,415
270,901
309,044
169,192
40,867
20,172
$ 188,262
250,882
289,985
176,941
2010
$ 8,007
2,340
879
3,219
11,226
1,979
4,130
5,117
1,899
$ 3,218
2.94%
7.38
14.07
36.79
$ 203,824
272,401
309,326
148,638
43,590
22,906
$ 194,038
274,624
312,807
161,279
% Change
(10)%
(3)
27
5
(6)
n/m
3
36
34
37
(7)
(1)
—
14
(6)
(12)
(3)
(9)
(7)
10
(1) Return on average economic capital and economic capital are non-GAAP financial measures. For additional information on these measures, see Supplemental Financial Data on page 32 and for
corresponding reconciliations to GAAP financial measures, see Statistical Table XVI.
n/m = not meaningful
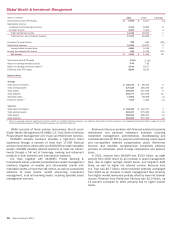
Global Commercial Banking provides a wide range of lending-
related products and services, integrated working capital
management and treasury solutions to clients through our network
of offices and client relationship teams along with various product
partners. Our clients include business banking and middle-market
companies, commercial real estate firms and governments, and
are generally defined as companies with annual sales up to
$2 billion. Our lending products and services include commercial
loans and commitment facilities, real estate lending, asset-based
lending and indirect consumer loans. Our capital management and
treasury solutions include treasury management, foreign
exchange and short-term investing options. Effective in 2011,
management responsibility for the merchant services joint venture,
Banc of America Merchant Services, LLC, was moved from GBAM
to Global Commercial Banking where it more closely aligns with
the business model. Prior periods have been reclassified to reflect
this change. In 2011, we recorded $1.1 billion of impairment
charges on our investment in the joint venture. Because of the
recent transfer of the joint venture to Global Commercial Banking,
the impairment charges were recorded in All Other. For additional
information, see Note 5 – Securities to the Consolidated Financial
Statements.
Net income increased $1.2 billion to $4.4 billion in 2011 from
2010 primarily driven by an improvement in the provision for credit
losses, offset by lower revenue and higher expenses.
Revenue decreased $673 million primarily driven by lower net
interest income related to ALM activities and lower average loan
balances, partially offset by an increase in average deposits as
clients continue to maintain high levels of liquidity. Noninterest
income increased $158 million largely due to a gain on the
termination of a purchase contract, an increase in tax credit and
commercial card income, and higher investment gains in the
commercial real estate portfolio.
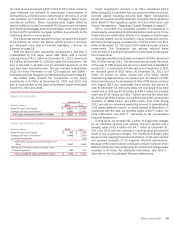
The provision for credit losses decreased $2.6 billion to a
benefit of $634 million for 2011 compared to 2010. The decrease
was driven by improved economic conditions and an accelerated
rate of loan resolutions in the commercial real estate portfolio.
Noninterest expense increased $104 million driven primarily
by higher FDIC expense.
The return on average economic capital increased due to higher
net income and the 12 percent decrease in average economic
capital. Economic capital decreased due to declining loan
balances and improvements in credit quality. Average allocated
equity decreased due to the same reasons as economic capital.
For more information regarding economic capital and allocated
equity, see Supplemental Financial Data on page 32.