Bank of America 2011 Annual Report Download - page 136
Download and view the complete annual report
Please find page 136 of the 2011 Bank of America annual report below. You can navigate through the pages in the report by either clicking on the pages listed below, or by using the keyword search tool below to find specific information within the annual report.-
 1
1 -
2
-
3
-
4
-
5
-
6
-
7
-
8
-
9
-
10
-
11
-
12
-
13
-
14
-
15
-
16
-
17
-
18
-
19
-
20
-
21
-
22
-
23
-
24
-
25
-
26
-
27
-
28
-
29
-
30
-
31
-
32
-
33
-
34
-
35
-
36
-
37
-
38
-
39
-
40
-
41
-
42
-
43
-
44
-
45
-
46
-
47
-
48
-
49
-
50
-
51
-
52
-
53
-
54
-
55
-
56
-
57
-
58
-
59
-
60
-
61
-
62
-
63
-
64
-
65
-
66
-
67
-
68
-
69
-
70
-
71
-
72
-
73
-
74
-
75
-
76
-
77
-
78
-
79
-
80
-
81
-
82
-
83
-
84
-
85
-
86
-
87
-
88
-
89
-
90
-
91
-
92
-
93
-
94
-
95
-
96
-
97
-
98
-
99
-
100
-
101
-
102
-
103
-
104
-
105
-
106
-
107
-
108
-
109
-
110
-
111
-
112
-
113
-
114
-
115
-
116
-
117
-
118
-
119
-
120
-
121
-
122
-
123
-
124
-
125
-
 126
126 -
 127
127 -
 128
128 -
 129
129 -
 130
130 -
 131
131 -
 132
132 -
 133
133 -
 134
134 -
 135
135 -
 136
136 -
 137
137 -
 138
138 -
 139
139 -
 140
140 -
 141
141 -
 142
142 -
 143
143 -
 144
144 -
 145
145 -
 146
146 -
147
-
148
-
149
-
150
-
151
-
152
-
153
-
154
-
155
-
156
-
157
-
158
-
159
-
160
-
161
-
162
-
163
-
164
-
165
-
166
-
167
-
168
-
169
-
170
-
171
-
172
-
173
-
174
-
175
-
176
-
177
-
178
-
179
-
180
-
181
-
182
-
183
-
184
-
185
-
186
-
187
-
188
-
189
-
190
-
191
-
192
-
193
-
194
-
195
-
196
-
197
-
198
-
199
-
200
-
201
-
202
-
203
-
204
-
205
-
206
-
207
-
208
-
209
-
210
-
211
-
212
-
213
-
214
-
215
-
216
-
217
-
218
-
219
-
220
-
221
-
222
-
223
-
224
-
225
-
226
-
227
-
228
-
229
-
230
-
231
-
232
-
233
-
234
-
235
-
236
-
237
-
238
-
239
-
240
-
241
-
242
-
243
-
244
-
245
-
246
-
247
-
248
-
249
-
250
-
251
-
252
-
253
-
254
-
255
-
256
-
257
-
258
-
259
-
260
-
261
-
262
-
263
-
264
-
265
-
266
-
267
-
268
-
269
-
270
-
271
-
272
-
273
-
274
-
275
-
276
 |
 |

134 Bank of America 2011
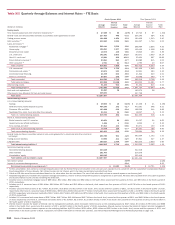
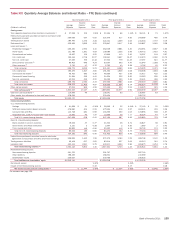
Table XIII Quarterly Average Balances and Interest Rates – FTE Basis
(Dollars in millions)
Earning assets
Time deposits placed and other short-term investments (1)
Federal funds sold and securities borrowed or purchased under agreements to resell
Trading account assets
Debt securities (2)
Loans and leases (3):
Residential mortgage (4)
Home equity
Discontinued real estate
U.S. credit card
Non-U.S. credit card
Direct/Indirect consumer (5)
Other consumer (6)
Total consumer
U.S. commercial
Commercial real estate (7)
Commercial lease financing
Non-U.S. commercial
Total commercial
Total loans and leases
Other earning assets
Total earning assets (8)
Cash and cash equivalents (1)
Other assets, less allowance for loan and lease losses
Total assets
Interest-bearing liabilities
U.S. interest-bearing deposits:
Savings
NOW and money market deposit accounts
Consumer CDs and IRAs
Negotiable CDs, public funds and other time deposits
Total U.S. interest-bearing deposits
Non-U.S. interest-bearing deposits:
Banks located in non-U.S. countries
Governments and official institutions
Time, savings and other
Total non-U.S. interest-bearing deposits
Total interest-bearing deposits
Federal funds purchased, securities loaned or sold under agreements to repurchase and other short-term
borrowings
Trading account liabilities
Long-term debt
Total interest-bearing liabilities (8)
Noninterest-bearing sources:
Noninterest-bearing deposits
Other liabilities
Shareholders’ equity
Total liabilities and shareholders’ equity
Net interest spread
Impact of noninterest-bearing sources
Net interest income/yield on earning assets (1)
Fourth Quarter 2011
Average
Balance
$ 27,688
237,453
161,848
332,990
266,144
126,251
14,073
102,241
15,981
90,861
2,751
618,302
196,778
40,673
21,278
55,867
314,596
932,898
91,109
1,783,986
94,287
329,294
$ 2,207,567
$ 39,609
454,249
103,488
22,413
619,759
20,454
1,466
57,814
79,734
699,493
284,766
70,999
389,557
1,444,815
333,038
201,479
228,235
$ 2,207,567
Interest
Income/
Expense
$85
449
1,354
2,245
2,596
1,207
128
2,603
420
863
41
7,858
1,798
343
204
395
2,740
10,598
904
15,635
36
$16
192
220
34
462
29
1
124
154
616
921
411
2,764
4,712
$ 10,923
Yield/
Rate
1.19%
0.75
3.33
2.69
3.90
3.80
3.65
10.10
10.41
3.77
6.14
5.06
3.63
3.34
3.84
2.80
3.46
4.52
3.95
3.49
0.16%
0.17
0.84
0.60
0.30
0.55
0.36
0.85
0.77
0.35
1.28
2.29
2.80
1.29
2.20%
0.24
2.44%
Third Quarter 2011
Average
Balance
$26,743
256,143
180,438
344,327
268,494
129,125
15,923
103,671
25,434
90,280
2,795
635,722
191,439
42,931
21,342
50,598
306,310
942,032
91,452
1,841,135
102,573
357,746
$2,301,454
$41,256
473,391
108,359
18,547
641,553
21,037
2,043
64,271
87,351
728,904
303,234
87,841
420,273
1,540,252
322,416
216,376
222,410
$2,301,454
Interest
Income/
Expense
$8
7
584
1,543
1,744
2,856
1,238
134
2,650
697
915
43
8,533
1,809
360
240
349
2,758
11,291
814
16,063
38
$21
248
244
5
518
34
2
150
186
704
1,152
547
2,959
5,362
$10,701
Yield/
Rate
1.31%
0.90
3.40
2.02
4.25
3.81
3.36
10.14
10.88
4.02
6.07
5.34
3.75
3.33
4.51
2.73
3.58
4.77
3.54
3.47
0.19%
0.21
0.89
0.12
0.32
0.65
0.32
0.93
0.85
0.38
1.51
2.47
2.82
1.39
2.08%
0.23
2.31%
(1) For this presentation, fees earned on overnight deposits placed with the Federal Reserve are included in the cash and cash equivalents line, consistent with the Corporation’s Consolidated Balance
Sheet presentation of these deposits. Net interest income and net interest yield in the table are calculated excluding these fees.
(2) Yields on AFS debt securities are calculated based on fair value rather than the cost basis. The use of fair value does not have a material impact on net interest yield.
(3) Nonperforming loans are included in the respective average loan balances. Income on these nonperforming loans is recognized on a cash basis. PCI loans were recorded at fair value upon acquisition
and accrete interest income over the remaining life of the loan.
(4) Includes non-U.S. residential mortgage loans of $88 million, $91 million, $94 million and $92 million in the fourth, third, second and first quarters of 2011, and $96 million in the fourth quarter of
2010, respectively.
(5) Includes non-U.S. consumer loans of $8.4 billion, $8.6 billion, $8.7 billion and $8.2 billion in the fourth, third, second and first quarters of 2011, and $7.9 billion in the fourth quarter of 2010,
respectively.
(6) Includes consumer finance loans of $1.7 billion, $1.8 billion, $1.8 billion and $1.9 billion in the fourth, third, second and first quarters of 2011, and $2.0 billion in the fourth quarter of 2010,
respectively; other non-U.S. consumer loans of $959 million, $932 million, $840 million and $777 million in the fourth, third, second and first quarters of 2011, and $791 million in the fourth quarter
of 2010, respectively; and consumer overdrafts of $107 million, $107 million, $79 million and $76 million in the fourth, third, second and first quarters of 2011, and $34 million in the fourth quarter
of 2010, respectively.
(7) Includes U.S. commercial real estate loans of $38.7 billion, $40.7 billion, $43.4 billion and $45.7 billion in the fourth, third, second and first quarters of 2011, and $49.0 billion in the fourth quarter
of 2010, respectively; and non-U.S. commercial real estate loans of $1.9 billion, $2.2 billion, $2.3 billion and $2.7 billion in the fourth, third, second and first quarters of 2011, and $2.6 billion in
the fourth quarter of 2010, respectively.
(8) Interest income includes the impact of interest rate risk management contracts, which decreased interest income on the underlying assets by $427 million, $1.0 billion, $739 million and $388
million in the fourth, third, second and first quarters of 2011, and $29 million in the fourth quarter of 2010, respectively. Interest expense includes the impact of interest rate risk management
contracts, which decreased interest expense on the underlying liabilities by $763 million, $631 million, $625 million and $621 million in the fourth, third, second and first quarters of 2011, and
$672 million in the fourth quarter of 2010, respectively. For further information on interest rate contracts, see Interest Rate Risk Management for Nontrading Activities on page 110.