Bank of America 2011 Annual Report Download - page 140
Download and view the complete annual report
Please find page 140 of the 2011 Bank of America annual report below. You can navigate through the pages in the report by either clicking on the pages listed below, or by using the keyword search tool below to find specific information within the annual report.-
 1
1 -
2
-
3
-
4
-
5
-
6
-
7
-
8
-
9
-
10
-
11
-
12
-
13
-
14
-
15
-
16
-
17
-
18
-
19
-
20
-
21
-
22
-
23
-
24
-
25
-
26
-
27
-
28
-
29
-
30
-
31
-
32
-
33
-
34
-
35
-
36
-
37
-
38
-
39
-
40
-
41
-
42
-
43
-
44
-
45
-
46
-
47
-
48
-
49
-
50
-
51
-
52
-
53
-
54
-
55
-
56
-
57
-
58
-
59
-
60
-
61
-
62
-
63
-
64
-
65
-
66
-
67
-
68
-
69
-
70
-
71
-
72
-
73
-
74
-
75
-
76
-
77
-
78
-
79
-
80
-
81
-
82
-
83
-
84
-
85
-
86
-
87
-
88
-
89
-
90
-
91
-
92
-
93
-
94
-
95
-
96
-
97
-
98
-
99
-
100
-
101
-
102
-
103
-
104
-
105
-
106
-
107
-
108
-
109
-
110
-
111
-
112
-
113
-
114
-
115
-
116
-
117
-
118
-
119
-
120
-
121
-
122
-
123
-
124
-
125
-
126
-
127
-
128
-
129
-
 130
130 -
 131
131 -
 132
132 -
 133
133 -
 134
134 -
 135
135 -
 136
136 -
 137
137 -
 138
138 -
 139
139 -
 140
140 -
 141
141 -
 142
142 -
 143
143 -
 144
144 -
 145
145 -
 146
146 -
 147
147 -
 148
148 -
 149
149 -
 150
150 -
151
-
152
-
153
-
154
-
155
-
156
-
157
-
158
-
159
-
160
-
161
-
162
-
163
-
164
-
165
-
166
-
167
-
168
-
169
-
170
-
171
-
172
-
173
-
174
-
175
-
176
-
177
-
178
-
179
-
180
-
181
-
182
-
183
-
184
-
185
-
186
-
187
-
188
-
189
-
190
-
191
-
192
-
193
-
194
-
195
-
196
-
197
-
198
-
199
-
200
-
201
-
202
-
203
-
204
-
205
-
206
-
207
-
208
-
209
-
210
-
211
-
212
-
213
-
214
-
215
-
216
-
217
-
218
-
219
-
220
-
221
-
222
-
223
-
224
-
225
-
226
-
227
-
228
-
229
-
230
-
231
-
232
-
233
-
234
-
235
-
236
-
237
-
238
-
239
-
240
-
241
-
242
-
243
-
244
-
245
-
246
-
247
-
248
-
249
-
250
-
251
-
252
-
253
-
254
-
255
-
256
-
257
-
258
-
259
-
260
-
261
-
262
-
263
-
264
-
265
-
266
-
267
-
268
-
269
-
270
-
271
-
272
-
273
-
274
-
275
-
276
 |
 |

138 Bank of America 2011
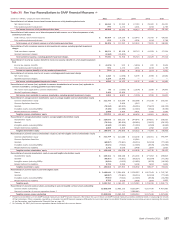
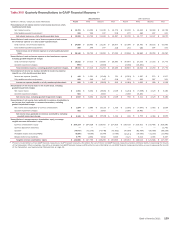
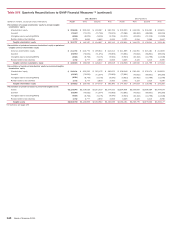
Table XVI Two Year Reconciliations to GAAP Financial Measures (1)
(Dollars in millions)
Deposits
Reported net income
Adjustment related to intangibles (2)
Adjusted net income
Average allocated equity
Adjustment related to goodwill and a percentage of intangibles
Average economic capital
Card Services
Reported net income (loss)
Adjustment related to intangibles (2)
Goodwill impairment charge
Adjusted net income
Average allocated equity
Adjustment related to goodwill and a percentage of intangibles
Average economic capital
Consumer Real Estate Services
Reported net loss
Adjustment related to intangibles (2)
Goodwill impairment charges
Adjusted net loss
Average allocated equity
Adjustment related to goodwill and a percentage of intangibles (excluding MSRs)
Average economic capital
Global Commercial Bank
Reported net income
Adjustment related to intangibles (2)
Adjusted net income
Average allocated equity
Adjustment related to goodwill and a percentage of intangibles
Average economic capital
Global Banking and Markets
Reported net income
Adjustment related to intangibles (2)
Adjusted net income
Average allocated equity
Adjustment related to goodwill and a percentage of intangibles
Average economic capital
Global Wealth and Investment Management
Reported net income
Adjustment related to intangibles (2)
Adjusted net income
Average allocated equity
Adjustment related to goodwill and a percentage of intangibles
Average economic capital
2011
$ 1,192
3
$ 1,195
$23,735
(17,949)
$ 5,786
$ 5,788
17
—
$ 5,805
$21,128
(10,589)
$10,539
$ (19,529)
—
2,603
$ (16,926)
$16,202
(1,350)
$14,852
$ 4,402
2
$ 4,404
$40,867
(20,695)
$20,172
$ 2,967
17
$ 2,984
$37,233
(10,650)
$26,583
$ 1,635
30
$ 1,665
$17,802
(10,696)
$ 7,106
2010
$ 1,362
10
$ 1,372
$ 24,222
(17,975)
$ 6,247
$ (6,980)
70
10,400
$ 3,490
$ 32,418
(17,644)
$ 14,774
$ (8,947)
3
2,000
$ (6,944)
$ 26,016
(4,802)
$ 21,214
$ 3,218
5
$ 3,223
$ 43,590
(20,684)
$ 22,906
$ 6,297
19
$ 6,316
$ 50,037
(10,106)
$ 39,931
$ 1,340
86
$ 1,426
$ 18,068
(10,778)
$ 7,290
(1) Presents reconciliations of non-GAAP financial measures to GAAP financial measures. We believe the use of these non-GAAP financial measures provides additional clarity in assessing the results
of the Corporation. Other companies may define or calculate non-GAAP financial measures differently. For more information on non-GAAP financial measures and ratios we use in assessing the results
of the Corporation, see Supplemental Financial Data on page 32.
(2) Represents cost of funds, earnings credit and certain expenses related to intangibles.