Bank of America 2011 Annual Report Download - page 188
Download and view the complete annual report
Please find page 188 of the 2011 Bank of America annual report below. You can navigate through the pages in the report by either clicking on the pages listed below, or by using the keyword search tool below to find specific information within the annual report.-
 1
1 -
2
-
3
-
4
-
5
-
6
-
7
-
8
-
9
-
10
-
11
-
12
-
13
-
14
-
15
-
16
-
17
-
18
-
19
-
20
-
21
-
22
-
23
-
24
-
25
-
26
-
27
-
28
-
29
-
30
-
31
-
32
-
33
-
34
-
35
-
36
-
37
-
38
-
39
-
40
-
41
-
42
-
43
-
44
-
45
-
46
-
47
-
48
-
49
-
50
-
51
-
52
-
53
-
54
-
55
-
56
-
57
-
58
-
59
-
60
-
61
-
62
-
63
-
64
-
65
-
66
-
67
-
68
-
69
-
70
-
71
-
72
-
73
-
74
-
75
-
76
-
77
-
78
-
79
-
80
-
81
-
82
-
83
-
84
-
85
-
86
-
87
-
88
-
89
-
90
-
91
-
92
-
93
-
94
-
95
-
96
-
97
-
98
-
99
-
100
-
101
-
102
-
103
-
104
-
105
-
106
-
107
-
108
-
109
-
110
-
111
-
112
-
113
-
114
-
115
-
116
-
117
-
118
-
119
-
120
-
121
-
122
-
123
-
124
-
125
-
126
-
127
-
128
-
129
-
130
-
131
-
132
-
133
-
134
-
135
-
136
-
137
-
138
-
139
-
140
-
141
-
142
-
143
-
144
-
145
-
146
-
147
-
148
-
149
-
150
-
151
-
152
-
153
-
154
-
155
-
156
-
157
-
158
-
159
-
160
-
161
-
162
-
163
-
164
-
165
-
166
-
167
-
168
-
169
-
170
-
171
-
172
-
173
-
174
-
175
-
176
-
177
-
 178
178 -
 179
179 -
 180
180 -
 181
181 -
 182
182 -
 183
183 -
 184
184 -
 185
185 -
 186
186 -
 187
187 -
 188
188 -
 189
189 -
 190
190 -
 191
191 -
 192
192 -
 193
193 -
 194
194 -
 195
195 -
 196
196 -
 197
197 -
 198
198 -
199
-
200
-
201
-
202
-
203
-
204
-
205
-
206
-
207
-
208
-
209
-
210
-
211
-
212
-
213
-
214
-
215
-
216
-
217
-
218
-
219
-
220
-
221
-
222
-
223
-
224
-
225
-
226
-
227
-
228
-
229
-
230
-
231
-
232
-
233
-
234
-
235
-
236
-
237
-
238
-
239
-
240
-
241
-
242
-
243
-
244
-
245
-
246
-
247
-
248
-
249
-
250
-
251
-
252
-
253
-
254
-
255
-
256
-
257
-
258
-
259
-
260
-
261
-
262
-
263
-
264
-
265
-
266
-
267
-
268
-
269
-
270
-
271
-
272
-
273
-
274
-
275
-
276
 |
 |

186 Bank of America 2011
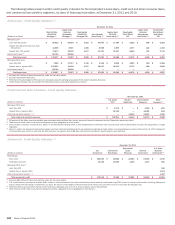
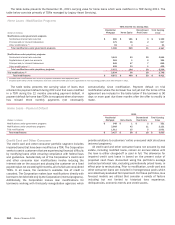
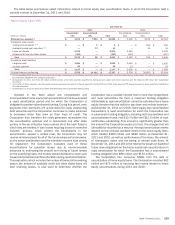
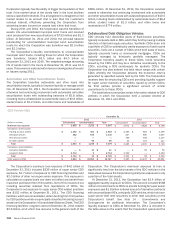
The table below provides information on the Corporation’s primary modification programs for the renegotiated TDR portfolio for
loans that were modified in TDRs during 2011.
Credit Card and Other Consumer – Renegotiated TDRs by Program Type
(Dollars in millions)
U.S. credit card
Non-U.S. credit card
Direct/Indirect consumer
Total renegotiated TDR loans
Renegotiated TDRs Entered into During 2011
December 31, 2011
Internal
Programs
$492
163
112
$767
External
Programs
$407
158
87
$652
Other
$3
1
—
$4
Total
$ 902
322
199
$ 1,423
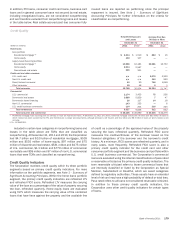
Credit card and other consumer loans are deemed to be in
payment default during the quarter in which a borrower misses the
second of two consecutive payments. Payment defaults are one
of the factors considered when projecting future cash flows in the
calculation of the allowance for loan losses for impaired credit
card and other consumer loans. Loans that entered into payment
default during 2011 and that had been modified in a TDR during
the 12 months preceding payment default were $863 million for
U.S. credit card, $409 million for non-U.S. credit card and $180
million for direct/indirect consumer.
Commercial Loans
Impaired commercial loans, which include nonperforming loans
and TDRs (both performing and nonperforming) are primarily
measured based on the present value of payments expected to
be received, discounted at the loan’s original effective interest
rate. Commercial impaired loans may also be measured based on
observable market prices or, for loans that are solely dependent
on the collateral for repayment, the estimated fair value of
collateral less estimated costs to sell. If the carrying value of a
loan exceeds this amount, a specific allowance is recorded as a
component of the allowance for loan and lease losses.
Modifications of loans to commercial borrowers that are
experiencing financial difficulty are designed to reduce the
Corporation’s loss exposure while providing the borrower with an
opportunity to work through financial difficulties, often to avoid
foreclosure or bankruptcy. Each modification is unique and reflects
the individual circumstances of the borrower. Modifications that
result in a TDR may include extensions of maturity at a
concessionary (below market) rate of interest, payment
forbearances or other actions designed to benefit the customer
while mitigating the Corporation’s risk exposure. Reductions in
interest rates are rare. Instead, the interest rates are typically
increased, although the increased rate may not represent a market
rate of interest. Infrequently, concessions may also include
principal forgiveness in connection with foreclosure, short sale or
other settlement agreements leading to termination or sale of the
loan.
At the time of restructuring, the loans are remeasured to reflect
the impact, if any, on projected cash flows, observable market
prices or collateral value resulting from the modified terms. If there
was no forgiveness of principal and the interest rate was not
decreased, the modification may have little or no impact on the
allowance established for the loan. If a portion of the loan is
deemed to be uncollectible, a charge-off may be recorded at the
time of restructuring. Alternatively, a charge-off may have already
been recorded in a previous period such that no charge-off is
required at the time of modification.
At December 31, 2011 and 2010, remaining commitments to
lend additional funds to debtors whose terms have been modified
in a commercial loan TDR were immaterial. Commercial foreclosed
properties totaled $612 million and $725 million at December 31,
2011 and 2010.