Bank of America 2011 Annual Report Download - page 153
Download and view the complete annual report
Please find page 153 of the 2011 Bank of America annual report below. You can navigate through the pages in the report by either clicking on the pages listed below, or by using the keyword search tool below to find specific information within the annual report.-
 1
1 -
2
-
3
-
4
-
5
-
6
-
7
-
8
-
9
-
10
-
11
-
12
-
13
-
14
-
15
-
16
-
17
-
18
-
19
-
20
-
21
-
22
-
23
-
24
-
25
-
26
-
27
-
28
-
29
-
30
-
31
-
32
-
33
-
34
-
35
-
36
-
37
-
38
-
39
-
40
-
41
-
42
-
43
-
44
-
45
-
46
-
47
-
48
-
49
-
50
-
51
-
52
-
53
-
54
-
55
-
56
-
57
-
58
-
59
-
60
-
61
-
62
-
63
-
64
-
65
-
66
-
67
-
68
-
69
-
70
-
71
-
72
-
73
-
74
-
75
-
76
-
77
-
78
-
79
-
80
-
81
-
82
-
83
-
84
-
85
-
86
-
87
-
88
-
89
-
90
-
91
-
92
-
93
-
94
-
95
-
96
-
97
-
98
-
99
-
100
-
101
-
102
-
103
-
104
-
105
-
106
-
107
-
108
-
109
-
110
-
111
-
112
-
113
-
114
-
115
-
116
-
117
-
118
-
119
-
120
-
121
-
122
-
123
-
124
-
125
-
126
-
127
-
128
-
129
-
130
-
131
-
132
-
133
-
134
-
135
-
136
-
137
-
138
-
139
-
140
-
141
-
142
-
 143
143 -
 144
144 -
 145
145 -
 146
146 -
 147
147 -
 148
148 -
 149
149 -
 150
150 -
 151
151 -
 152
152 -
 153
153 -
 154
154 -
 155
155 -
 156
156 -
 157
157 -
 158
158 -
 159
159 -
 160
160 -
 161
161 -
 162
162 -
 163
163 -
164
-
165
-
166
-
167
-
168
-
169
-
170
-
171
-
172
-
173
-
174
-
175
-
176
-
177
-
178
-
179
-
180
-
181
-
182
-
183
-
184
-
185
-
186
-
187
-
188
-
189
-
190
-
191
-
192
-
193
-
194
-
195
-
196
-
197
-
198
-
199
-
200
-
201
-
202
-
203
-
204
-
205
-
206
-
207
-
208
-
209
-
210
-
211
-
212
-
213
-
214
-
215
-
216
-
217
-
218
-
219
-
220
-
221
-
222
-
223
-
224
-
225
-
226
-
227
-
228
-
229
-
230
-
231
-
232
-
233
-
234
-
235
-
236
-
237
-
238
-
239
-
240
-
241
-
242
-
243
-
244
-
245
-
246
-
247
-
248
-
249
-
250
-
251
-
252
-
253
-
254
-
255
-
256
-
257
-
258
-
259
-
260
-
261
-
262
-
263
-
264
-
265
-
266
-
267
-
268
-
269
-
270
-
271
-
272
-
273
-
274
-
275
-
276
 |
 |

Bank of America 2011 151
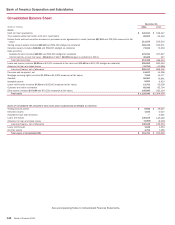
Bank of America Corporation and Subsidiaries
Consolidated Statement of Cash Flows
(Dollars in millions)
Operating activities
Net income (loss)
Reconciliation of net income (loss) to net cash provided by operating activities:
Provision for credit losses
Goodwill impairment
Gains on sales of debt securities
Depreciation and premises improvements amortization
Amortization of intangibles
Deferred income taxes
Net decrease in trading and derivative instruments
Net decrease in other assets
Net increase (decrease) in accrued expenses and other liabilities
Other operating activities, net
Net cash provided by operating activities
Investing activities
Net (increase) decrease in time deposits placed and other short-term investments
Net (increase) decrease in federal funds sold and securities borrowed or purchased under agreements to resell
Proceeds from sales of available-for-sale debt securities
Proceeds from paydowns and maturities of available-for-sale debt securities
Purchases of available-for-sale debt securities
Proceeds from maturities of held-to-maturity debt securities
Purchases of held-to-maturity debt securities
Proceeds from sales of loans and leases
Other changes in loans and leases, net
Net purchases of premises and equipment
Proceeds from sales of foreclosed properties
Cash received upon acquisition, net
Cash received due to impact of adoption of consolidation guidance
Other investing activities, net
Net cash provided by (used in) investing activities
Financing activities
Net increase in deposits
Net decrease in federal funds purchased and securities loaned or sold under agreements to repurchase
Net decrease in commercial paper and other short-term borrowings
Proceeds from issuance of long-term debt
Retirement of long-term debt
Proceeds from issuance of preferred stock and warrants
Repayment of preferred stock
Proceeds from issuance of common stock
Cash dividends paid
Other financing activities, net
Net cash used in financing activities
Effect of exchange rate changes on cash and cash equivalents
Net increase (decrease) in cash and cash equivalents
Cash and cash equivalents at January 1
Cash and cash equivalents at December 31
Supplemental cash flow disclosures
Interest paid
Income taxes paid
Income taxes refunded
2011
$ 1,446
13,410
3,184
(3,374)
1,976
1,509
(1,949)
20,230
50,230
(18,124)
(4,048)
64,490
105
(1,567)
120,125
56,732
(99,536)
602
(35,552)
2,409
(6,059)
(1,307)
2,532
—
—
13,945
52,429
22,611
(30,495)
(24,264)
26,001
(101,814)
5,000
—
—
(1,738)
3
(104,696)
(548)
11,675
108,427
$ 120,102
$ 25,207
1,653
(781)
2010
$ (2,238)
28,435
12,400
(2,526)
2,181
1,731
608
20,775
5,213
14,069
1,946
82,594
(2,154)
(19,683)
100,047
70,868
(199,159)
11
(100)
8,046
(2,550)
(987)
3,107
—
2,807
9,400
(30,347)
36,598
(9,826)
(31,698)
52,215
(110,919)
—
—
—
(1,762)
5
(65,387)
228
(12,912)
121,339
$ 108,427
$21,166
1,465
(7,783)
2009
$6,276
48,570
—
(4,723)
2,336
1,978
370
59,822
28,553
(16,601)
3,150
129,731
19,081
31,369
164,155
59,949
(185,145)
2,771
(3,914)
7,592
21,257
(2,240)
1,997
31,804
—
9,249
157,925
10,507
(62,993)
(126,426)
67,744
(101,207)
49,244
(45,000)
13,468
(4,863)
(42)
(199,568)
394
88,482
32,857
$121,339
$37,602
2,964
(31)
During 2011, the Corporation entered into an agreement with Assured Guaranty Ltd. and subsidiaries which resulted in non-cash increases to loans of $2.2 billion, other assets of $82 million and long-
term debt of $2.3 billion.
During 2011, the Corporation exchanged preferred stock, with a carrying value of $1.1 billion, for 92 million common shares valued at $522 million and senior notes valued at $360 million.
During 2011, the Corporation exchanged trust preferred securities for 308 million common shares valued at $1.7 billion and senior notes valued at $2.0 billion. The trust preferred securities, and
underlying junior subordinated notes and stock purchase agreements, with a carrying value of $5.2 billion, were immediately canceled.
During 2010 and 2009, the Corporation securitized $2.4 billion and $14.0 billion of residential mortgage loans into mortgage-backed securities which were retained by the Corporation. There were no
residential mortgage loans securitized into mortgage-backed securities which were retained by the Corporation during 2011.
During 2010, the Corporation sold First Republic Bank in a non-cash transaction that reduced assets and liabilities by $19.5 billion and $18.1 billion.
During 2009, the Corporation exchanged $14.8 billion of preferred stock by issuing approximately 1.0 billion in shares of common stock valued at $11.5 billion.
During 2009, the Corporation exchanged credit card loans of $8.5 billion and the related allowance for loan and lease losses of $750 million for a $7.8 billion held-to-maturity debt security that was
issued by the Corporation’s U.S. credit card securitization trust and retained by the Corporation.
The acquisition-date fair values of non-cash assets acquired and liabilities assumed in the Merrill Lynch & Co., Inc. (Merrill Lynch) acquisition were $619.1 billion and $626.8 billion.
Approximately 1.4 billion shares of common stock valued at approximately $20.5 billion and 376 thousand shares of preferred stock valued at approximately $8.6 billion were issued in connection with
the Merrill Lynch acquisition.
See accompanying Notes to Consolidated Financial Statements.