Bank of America 2011 Annual Report Download - page 182
Download and view the complete annual report
Please find page 182 of the 2011 Bank of America annual report below. You can navigate through the pages in the report by either clicking on the pages listed below, or by using the keyword search tool below to find specific information within the annual report.-
 1
1 -
2
-
3
-
4
-
5
-
6
-
7
-
8
-
9
-
10
-
11
-
12
-
13
-
14
-
15
-
16
-
17
-
18
-
19
-
20
-
21
-
22
-
23
-
24
-
25
-
26
-
27
-
28
-
29
-
30
-
31
-
32
-
33
-
34
-
35
-
36
-
37
-
38
-
39
-
40
-
41
-
42
-
43
-
44
-
45
-
46
-
47
-
48
-
49
-
50
-
51
-
52
-
53
-
54
-
55
-
56
-
57
-
58
-
59
-
60
-
61
-
62
-
63
-
64
-
65
-
66
-
67
-
68
-
69
-
70
-
71
-
72
-
73
-
74
-
75
-
76
-
77
-
78
-
79
-
80
-
81
-
82
-
83
-
84
-
85
-
86
-
87
-
88
-
89
-
90
-
91
-
92
-
93
-
94
-
95
-
96
-
97
-
98
-
99
-
100
-
101
-
102
-
103
-
104
-
105
-
106
-
107
-
108
-
109
-
110
-
111
-
112
-
113
-
114
-
115
-
116
-
117
-
118
-
119
-
120
-
121
-
122
-
123
-
124
-
125
-
126
-
127
-
128
-
129
-
130
-
131
-
132
-
133
-
134
-
135
-
136
-
137
-
138
-
139
-
140
-
141
-
142
-
143
-
144
-
145
-
146
-
147
-
148
-
149
-
150
-
151
-
152
-
153
-
154
-
155
-
156
-
157
-
158
-
159
-
160
-
161
-
162
-
163
-
164
-
165
-
166
-
167
-
168
-
169
-
170
-
171
-
 172
172 -
 173
173 -
 174
174 -
 175
175 -
 176
176 -
 177
177 -
 178
178 -
 179
179 -
 180
180 -
 181
181 -
 182
182 -
 183
183 -
 184
184 -
 185
185 -
 186
186 -
 187
187 -
 188
188 -
 189
189 -
 190
190 -
 191
191 -
 192
192 -
193
-
194
-
195
-
196
-
197
-
198
-
199
-
200
-
201
-
202
-
203
-
204
-
205
-
206
-
207
-
208
-
209
-
210
-
211
-
212
-
213
-
214
-
215
-
216
-
217
-
218
-
219
-
220
-
221
-
222
-
223
-
224
-
225
-
226
-
227
-
228
-
229
-
230
-
231
-
232
-
233
-
234
-
235
-
236
-
237
-
238
-
239
-
240
-
241
-
242
-
243
-
244
-
245
-
246
-
247
-
248
-
249
-
250
-
251
-
252
-
253
-
254
-
255
-
256
-
257
-
258
-
259
-
260
-
261
-
262
-
263
-
264
-
265
-
266
-
267
-
268
-
269
-
270
-
271
-
272
-
273
-
274
-
275
-
276
 |
 |

180 Bank of America 2011
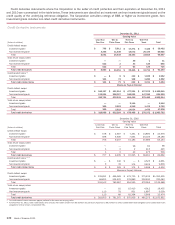
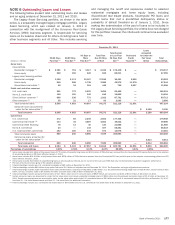
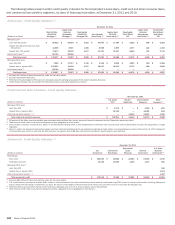
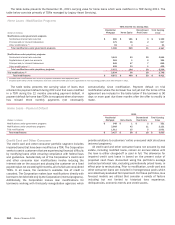
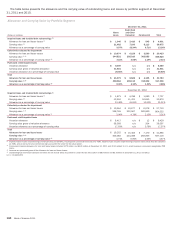
The following tables present certain credit quality indicators for the Corporation’s home loans, credit card and other consumer loans,
and commercial loan portfolio segments, by class of financing receivables, at December 31, 2011 and 2010.
Home Loans - Credit Quality Indicators (1)
(Dollars in millions)
Refreshed LTV (3)
Less than 90 percent
Greater than 90 percent but less than
100 percent
Greater than 100 percent
Fully-insured loans (4)
Total home loans
Refreshed FICO score
Less than 620
Greater than or equal to 620
Fully-insured loans (4)
Total home loans
December 31, 2011
Core Portfolio
Residential
Mortgage (2)
$ 80,032
11,838
17,673
68,794
$ 178,337
$ 7,020
102,523
68,794
$ 178,337
Legacy Asset
Servicing
Residential
Mortgage (2)
$ 20,450
5,847
22,630
25,060
$ 73,987
$ 17,337
31,590
25,060
$ 73,987
Countrywide
Residential
Mortgage PCI
$ 3,821
1,468
4,677
—
$ 9,966
$ 3,749
6,217
—
$ 9,966
Core Portfolio
Home Equity (2)
$ 46,646
6,988
13,421
—
$ 67,055
$ 4,148
62,907
—
$ 67,055
Legacy Asset
Servicing
Home Equity (2)
$ 17,354
4,995
23,317
—
$ 45,666
$ 8,990
36,676
—
$ 45,666
Countrywide
Home Equity
PCI
$ 2,253
1,077
8,648
—
$ 11,978
$ 3,203
8,775
—
$ 11,978
Legacy Asset
Servicing
Discontinued
Real Estate (2)
$ 895
122
221
—
$ 1,238
$ 548
690
—
$ 1,238
Countrywide
Discontinued
Real Estate
PCI
$ 5,953
1,191
2,713
—
$ 9,857
$ 5,968
3,889
—
$ 9,857
(1) Excludes $2.2 billion of loans accounted for under the fair value option.
(2) Excludes Countrywide PCI loans.
(3) Refreshed LTV percentages for PCI loans are calculated using the carrying value gross of the related valuation allowance.
(4) Credit quality indicators are not reported for fully-insured loans as principal repayment is insured.
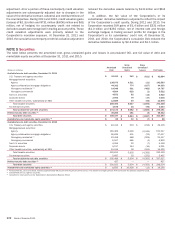
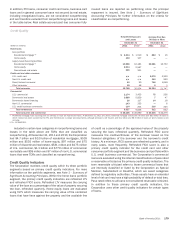
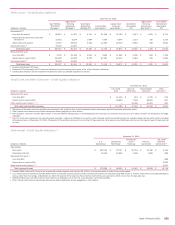
Credit Card and Other Consumer - Credit Quality Indicators
(Dollars in millions)
Refreshed FICO score
Less than 620
Greater than or equal to 620
Other internal credit metrics (2, 3, 4)
Total credit card and other consumer
December 31, 2011
U.S. Credit
Card
$ 8,172
94,119
—
$ 102,291
Non-U.S.
Credit Card
$—
—
14,418
$ 14,418
Direct/Indirect
Consumer
$ 3,325
46,981
39,407
$ 89,713
Other
Consumer (1)
$ 802
854
1,032
$ 2,688
(1) 96 percent of the other consumer portfolio was associated with portfolios from certain consumer finance businesses that the Corporation previously exited.
(2) Other internal credit metrics may include delinquency status, geography or other factors.
(3) Direct/indirect consumer includes $31.1 billion of securities-based lending which is overcollateralized and therefore has minimal credit risk and $6.0 billion of loans the Corporation no longer
originates.
(4) Non-U.S. credit card represents the select European countries’ credit card portfolios which are evaluated using internal credit metrics, including delinquency status. At December 31, 2011, 96 percent
of this portfolio was current or less than 30 days past due, two percent was 30-89 days past due and two percent was 90 days or more past due.
Commercial - Credit Quality Indicators (1)
(Dollars in millions)
Risk Ratings
Pass rated
Reservable criticized
Refreshed FICO score (3)
Less than 620
Greater than or equal to 620
Other internal credit metrics (3, 4)
Total commercial credit
December 31, 2011
U.S.
Commercial
$ 169,599
10,349
$ 179,948
Commercial
Real Estate
$ 28,602
10,994
$ 39,596
Commercial
Lease
Financing
$ 20,850
1,139
$ 21,989
Non-U.S.
Commercial
$ 53,945
1,473
$ 55,418
U.S. Small
Business
Commercial (2)
$ 2,392
836
562
4,674
4,787
$ 13,251
(1) Excludes $6.6 billion of loans accounted for under the fair value option.
(2) U.S. small business commercial includes $491 million of criticized business card and small business loans which are evaluated using FICO scores or internal credit metrics, including delinquency
status, rather than risk ratings. At December 31, 2011, 97 percent of the balances where internal credit metrics are used were current or less than 30 days past due.
(3) Refreshed FICO score and other internal credit metrics are applicable only to the U.S. small business commercial portfolio.
(4) Other internal credit metrics may include delinquency status, application scores, geography or other factors.