Bank of America 2011 Annual Report Download - page 248
Download and view the complete annual report
Please find page 248 of the 2011 Bank of America annual report below. You can navigate through the pages in the report by either clicking on the pages listed below, or by using the keyword search tool below to find specific information within the annual report.-
 1
1 -
2
-
3
-
4
-
5
-
6
-
7
-
8
-
9
-
10
-
11
-
12
-
13
-
14
-
15
-
16
-
17
-
18
-
19
-
20
-
21
-
22
-
23
-
24
-
25
-
26
-
27
-
28
-
29
-
30
-
31
-
32
-
33
-
34
-
35
-
36
-
37
-
38
-
39
-
40
-
41
-
42
-
43
-
44
-
45
-
46
-
47
-
48
-
49
-
50
-
51
-
52
-
53
-
54
-
55
-
56
-
57
-
58
-
59
-
60
-
61
-
62
-
63
-
64
-
65
-
66
-
67
-
68
-
69
-
70
-
71
-
72
-
73
-
74
-
75
-
76
-
77
-
78
-
79
-
80
-
81
-
82
-
83
-
84
-
85
-
86
-
87
-
88
-
89
-
90
-
91
-
92
-
93
-
94
-
95
-
96
-
97
-
98
-
99
-
100
-
101
-
102
-
103
-
104
-
105
-
106
-
107
-
108
-
109
-
110
-
111
-
112
-
113
-
114
-
115
-
116
-
117
-
118
-
119
-
120
-
121
-
122
-
123
-
124
-
125
-
126
-
127
-
128
-
129
-
130
-
131
-
132
-
133
-
134
-
135
-
136
-
137
-
138
-
139
-
140
-
141
-
142
-
143
-
144
-
145
-
146
-
147
-
148
-
149
-
150
-
151
-
152
-
153
-
154
-
155
-
156
-
157
-
158
-
159
-
160
-
161
-
162
-
163
-
164
-
165
-
166
-
167
-
168
-
169
-
170
-
171
-
172
-
173
-
174
-
175
-
176
-
177
-
178
-
179
-
180
-
181
-
182
-
183
-
184
-
185
-
186
-
187
-
188
-
189
-
190
-
191
-
192
-
193
-
194
-
195
-
196
-
197
-
198
-
199
-
200
-
201
-
202
-
203
-
204
-
205
-
206
-
207
-
208
-
209
-
210
-
211
-
212
-
213
-
214
-
215
-
216
-
217
-
218
-
219
-
220
-
221
-
222
-
223
-
224
-
225
-
226
-
227
-
228
-
229
-
230
-
231
-
232
-
233
-
234
-
235
-
236
-
237
-
 238
238 -
 239
239 -
 240
240 -
 241
241 -
 242
242 -
 243
243 -
 244
244 -
 245
245 -
 246
246 -
 247
247 -
 248
248 -
 249
249 -
 250
250 -
 251
251 -
 252
252 -
 253
253 -
 254
254 -
 255
255 -
 256
256 -
 257
257 -
 258
258 -
259
-
260
-
261
-
262
-
263
-
264
-
265
-
266
-
267
-
268
-
269
-
270
-
271
-
272
-
273
-
274
-
275
-
276
 |
 |

246 Bank of America 2011
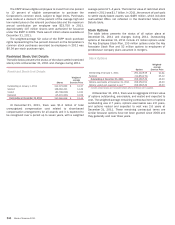
At December 31, 2011, 2010 and 2009, the balance of the
Corporation’s UTBs which would, if recognized, affect the
Corporation’s effective tax rate was $3.3 billion, $3.4 billion and
$4.0 billion, respectively. Included in the UTB balance are some
items the recognition of which would not affect the effective tax
rate, such as the tax effect of certain temporary differences, the
portion of gross state UTBs that would be offset by the tax benefit
of the associated federal deduction and the portion of gross non-
U.S. UTBs that would be offset by tax reductions in other
jurisdictions.
The Corporation files income tax returns in more than 100 state
and non-U.S. jurisdictions each year. The IRS and other tax
authorities in countries and states in which it has significant
business operations examine tax returns periodically
(continuously in some jurisdictions). The Tax Examination Status
table summarizes the status of significant examinations (U.S.
federal unless otherwise noted) for the Corporation and various
acquired subsidiaries as of December 31, 2011.
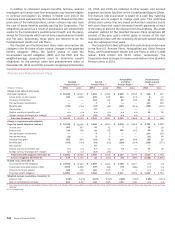
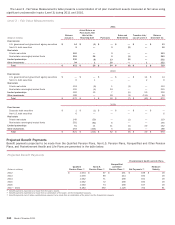
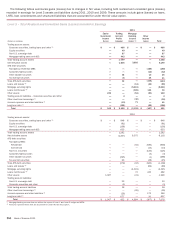
Tax Examination Status
Bank of America Corporation – U.S.
Bank of America Corporation – New York
Merrill Lynch – U.S.
Various – U.K.
Fleet Boston – U.S.
Years under
Examination (1)
2001 – 2009
1999 – 2003
2004 -- 2008
2007 -- 2009
2001 – 2004
Status at
December 31,
2011
See below
Field examination
See below
Field examination
In Appeals process
(1) All tax years subsequent to the years shown remain open to examination.
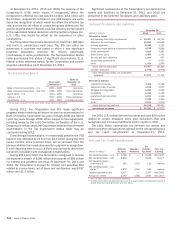
During 2011, the Corporation and IRS made significant
progress toward resolving all federal income tax examinations for
Bank of America Corporation tax years through 2009 and Merrill
Lynch tax years through 2008. While subject to final agreement,
including review by the Joint Committee on Taxation of the U.S.
Congress for certain years, the Corporation believes that all federal
examinations in the Tax Examination Status table may be
concluded during 2012.
Considering all examinations, it is reasonably possible the UTB
balance may decrease by as much as $2.6 billion during the next
twelve months, since resolved items will be removed from the
balance whether their resolution results in payment or recognition.
If such decrease were to occur, it likely would primarily result from
outcomes consistent with management expectations.
During 2011 and 2010, the Corporation recognized in income
tax expense a benefit of $168 million and expense of $99 million
for interest and penalties net-of-tax. At December 31, 2011 and
2010, the Corporation’s accrual for interest and penalties that
related to income taxes, net of taxes and remittances, was $787
million and $1.1 billion.
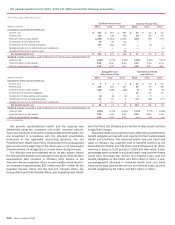
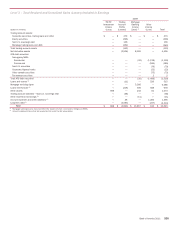
Significant components of the Corporation’s net deferred tax
assets and liabilities at December 31, 2011 and 2010 are
presented in the Deferred Tax Assets and Liabilities table.
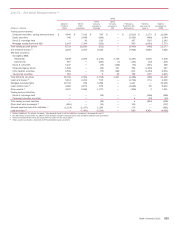
Deferred Tax Assets and Liabilities
(Dollars in millions)
Deferred tax assets
Net operating loss (NOL) carryforwards
Allowance for credit losses
Accrued expenses
Employee compensation and retirement benefits
Credit carryforwards
State income taxes
Security and loan valuations
Capital loss carryforwards
Other
Gross deferred tax assets
Valuation allowance
Total deferred tax assets, net of valuation
allowance
Deferred tax liabilities
Long-term borrowings
Equipment lease financing
Mortgage servicing rights
Intangibles
Available-for-sale securities
Fee income
Other
Gross deferred tax liabilities
Net deferred tax assets
December 31
2011
$ 14,307
11,824
8,340
4,792
4,510
2,489
1,091
—
1,654
49,007
(1,796)
47,211
3,360
3,042
1,993
1,894
1,811
1,038
2,074
15,212
$ 31,999
2010
$ 18,732
14,659
3,550
3,868
4,183
1,791
427
1,530
1,960
50,700
(2,976)
47,724
3,328
2,957
4,280
2,146
4,330
1,235
2,375
20,651
$ 27,073
The 2010 U.S. federal deferred tax asset excludes $56 million
related to certain employee stock plan deductions that was
recognized and increased additional paid-in capital in 2011.
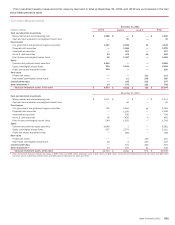
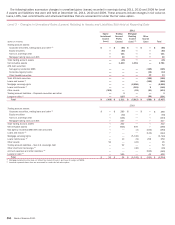
The table below summarizes the deferred tax assets and
related valuation allowances recognized for the net operating loss
and tax credit carryforwards at December 31, 2011.
NOL and Tax Credit Carryforwards
(Dollars in millions)
Net operating losses – U.S.
Net operating losses – U.K.
Net operating losses –
other non-U.S.
Net operating losses – U.S.
states (2)
General business credits
Foreign tax credits
Deferred
Tax Asset
$ 5,088
8,836
383
1,879
2,327
2,183
Valuation
Allowance
$—
—
(251)
(915)
—
(246)
Net
Deferred
Tax Asset
$ 5,088
8,836
132
964
2,327
1,937
First Year
Expiring
After 2027
None (1)
Various
Various
After 2027
After 2017
(1) The U.K. NOLs may be carried forward indefinitely.
(2) The NOLs and related valuation allowances for U.S. states before considering the benefit of
federal deductions were $2.9 billion and $1.4 billion.