Bank of America 2011 Annual Report Download - page 86
Download and view the complete annual report
Please find page 86 of the 2011 Bank of America annual report below. You can navigate through the pages in the report by either clicking on the pages listed below, or by using the keyword search tool below to find specific information within the annual report.-
 1
1 -
2
-
3
-
4
-
5
-
6
-
7
-
8
-
9
-
10
-
11
-
12
-
13
-
14
-
15
-
16
-
17
-
18
-
19
-
20
-
21
-
22
-
23
-
24
-
25
-
26
-
27
-
28
-
29
-
30
-
31
-
32
-
33
-
34
-
35
-
36
-
37
-
38
-
39
-
40
-
41
-
42
-
43
-
44
-
45
-
46
-
47
-
48
-
49
-
50
-
51
-
52
-
53
-
54
-
55
-
56
-
57
-
58
-
59
-
60
-
61
-
62
-
63
-
64
-
65
-
66
-
67
-
68
-
69
-
70
-
71
-
72
-
73
-
74
-
75
-
 76
76 -
 77
77 -
 78
78 -
 79
79 -
 80
80 -
 81
81 -
 82
82 -
 83
83 -
 84
84 -
 85
85 -
 86
86 -
 87
87 -
 88
88 -
 89
89 -
 90
90 -
 91
91 -
 92
92 -
 93
93 -
 94
94 -
 95
95 -
 96
96 -
97
-
98
-
99
-
100
-
101
-
102
-
103
-
104
-
105
-
106
-
107
-
108
-
109
-
110
-
111
-
112
-
113
-
114
-
115
-
116
-
117
-
118
-
119
-
120
-
121
-
122
-
123
-
124
-
125
-
126
-
127
-
128
-
129
-
130
-
131
-
132
-
133
-
134
-
135
-
136
-
137
-
138
-
139
-
140
-
141
-
142
-
143
-
144
-
145
-
146
-
147
-
148
-
149
-
150
-
151
-
152
-
153
-
154
-
155
-
156
-
157
-
158
-
159
-
160
-
161
-
162
-
163
-
164
-
165
-
166
-
167
-
168
-
169
-
170
-
171
-
172
-
173
-
174
-
175
-
176
-
177
-
178
-
179
-
180
-
181
-
182
-
183
-
184
-
185
-
186
-
187
-
188
-
189
-
190
-
191
-
192
-
193
-
194
-
195
-
196
-
197
-
198
-
199
-
200
-
201
-
202
-
203
-
204
-
205
-
206
-
207
-
208
-
209
-
210
-
211
-
212
-
213
-
214
-
215
-
216
-
217
-
218
-
219
-
220
-
221
-
222
-
223
-
224
-
225
-
226
-
227
-
228
-
229
-
230
-
231
-
232
-
233
-
234
-
235
-
236
-
237
-
238
-
239
-
240
-
241
-
242
-
243
-
244
-
245
-
246
-
247
-
248
-
249
-
250
-
251
-
252
-
253
-
254
-
255
-
256
-
257
-
258
-
259
-
260
-
261
-
262
-
263
-
264
-
265
-
266
-
267
-
268
-
269
-
270
-
271
-
272
-
273
-
274
-
275
-
276
 |
 |

84 Bank of America 2011
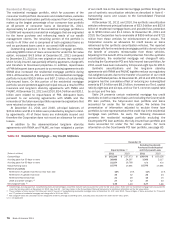
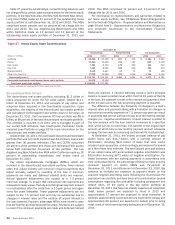
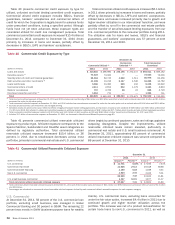
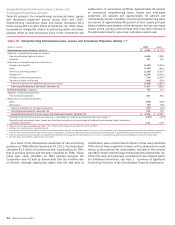
Purchased Credit-impaired Home Equity Loan Portfolio
The Countrywide PCI home equity portfolio comprised 38 percent
of the total Countrywide PCI loan portfolio. Those loans with a
refreshed FICO score below 620 represented 27 percent of the
Countrywide PCI home equity portfolio at December 31, 2011.
Loans with a refreshed CLTV greater than 90 percent represented
81 percent of the Countrywide PCI home equity portfolio after
consideration of purchase accounting adjustments and the related
valuation allowance, and 83 percent based on the unpaid principal
balance at December 31, 2011. Table 30 presents outstandings
net of purchase accounting adjustments and before the related
valuation allowance, by certain state concentrations.
Table 30
(Dollars in millions)
California
Florida
Arizona
Virginia
Colorado
Other U.S./Non-U.S.
Total Countrywide purchased credit-impaired home
equity portfolio
Outstanding Countrywide Purchased Credit-
impaired Loan Portfolio – Home Equity State
Concentrations
December 31
2011
$ 3,999
734
501
496
337
5,911
$ 11,978
2010
$ 4,178
750
520
532
375
6,235
$ 12,590
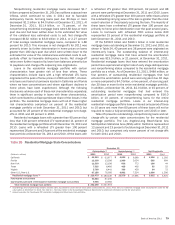
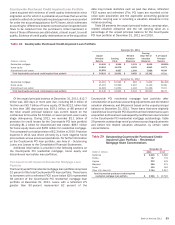
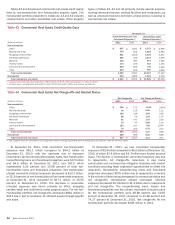
Purchased Credit-impaired Discontinued Real Estate Loan
Portfolio
The Countrywide PCI discontinued real estate loan portfolio
comprised 31 percent of the total Countrywide PCI loan portfolio.
Those loans to borrowers with a refreshed FICO score below 620
represented 61 percent of the Countrywide PCI discontinued real
estate loan portfolio at December 31, 2011. Loans with a
refreshed LTV, or CLTV in the case of second-liens, greater than
90 percent represented 40 percent of the Countrywide PCI
discontinued real estate loan portfolio after consideration of
purchase accounting adjustments and the related valuation
allowance, and 84 percent based on the unpaid principal balance
at December 31, 2011. Those loans that were originally classified
as discontinued real estate loans upon acquisition and have been
subsequently modified are now excluded from this portfolio and
included in the Countrywide PCI residential mortgage loan
portfolio, but remain in the PCI loan pool. Table 31 presents
outstandings net of purchase accounting adjustments and before
the related valuation adjustment, by certain state concentrations.
Table 31
(Dollars in millions)
California
Florida
Washington
Virginia
Arizona
Other U.S./Non-U.S.
Total Countrywide purchased credit-impaired
discontinued real estate loan portfolio
Outstanding Countrywide Purchased Credit-
impaired Loan Portfolio – Discontinued Real
Estate State Concentrations
December 31
2011
$ 5,262
958
331
277
251
2,778
$ 9,857
2010
$ 6,322
1,121
368
344
339
3,158
$ 11,652
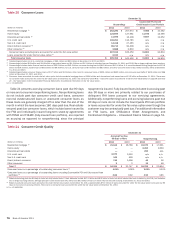
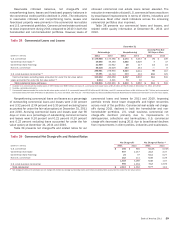
U.S. Credit Card
The consumer U.S. credit card portfolio is managed in Card
Services. Outstandings in the U.S. credit card loan portfolio
decreased $11.5 billion compared to December 31, 2010 due to
higher payment rates, charge-offs and portfolio divestitures. For
2011, net charge-offs decreased $5.8 billion to $7.3 billion
compared to 2010 due to improvements in delinquencies,
collections and bankruptcies as a result of an improved economic
environment and the impact of higher credit quality originations.
U.S. credit card loans 30 days or more past due and still accruing
interest decreased $2.1 billion while loans 90 days or more past
due and still accruing interest decreased $1.3 billion compared
to December 31, 2010 due to improvement in the U.S. economy.
Table 32 presents certain key credit statistics for the consumer
U.S. credit card portfolio.
Table 32
(Dollars in millions)
Outstandings
Accruing past due 30 days or more
Accruing past due 90 days or more
Net charge-offs
Net charge-off ratios (1)
U.S. Credit Card – Key Credit Statistics
December 31
2011
$ 102,291
3,823
2,070
2011
$ 7,276
6.90%
2010
$113,785
5,913
3,320
2010
$ 13,027
11.04%
(1) Net charge-off ratios are calculated as net charge-offs divided by average outstanding loans
and leases.
Unused lines of credit for U.S. credit card totaled $368.1 billion
and $399.7 billion at December 31, 2011 and 2010. The $31.6
billion decrease was driven by portfolio divestitures, closure of
inactive accounts and account management initiatives on higher
risk accounts.