Bank of America 2011 Annual Report Download - page 35
Download and view the complete annual report
Please find page 35 of the 2011 Bank of America annual report below. You can navigate through the pages in the report by either clicking on the pages listed below, or by using the keyword search tool below to find specific information within the annual report.-
 1
1 -
2
-
3
-
4
-
5
-
6
-
7
-
8
-
9
-
10
-
11
-
12
-
13
-
14
-
15
-
16
-
17
-
18
-
19
-
20
-
21
-
22
-
23
-
24
-
 25
25 -
 26
26 -
 27
27 -
 28
28 -
 29
29 -
 30
30 -
 31
31 -
 32
32 -
 33
33 -
 34
34 -
 35
35 -
 36
36 -
 37
37 -
 38
38 -
 39
39 -
 40
40 -
 41
41 -
 42
42 -
 43
43 -
 44
44 -
 45
45 -
46
-
47
-
48
-
49
-
50
-
51
-
52
-
53
-
54
-
55
-
56
-
57
-
58
-
59
-
60
-
61
-
62
-
63
-
64
-
65
-
66
-
67
-
68
-
69
-
70
-
71
-
72
-
73
-
74
-
75
-
76
-
77
-
78
-
79
-
80
-
81
-
82
-
83
-
84
-
85
-
86
-
87
-
88
-
89
-
90
-
91
-
92
-
93
-
94
-
95
-
96
-
97
-
98
-
99
-
100
-
101
-
102
-
103
-
104
-
105
-
106
-
107
-
108
-
109
-
110
-
111
-
112
-
113
-
114
-
115
-
116
-
117
-
118
-
119
-
120
-
121
-
122
-
123
-
124
-
125
-
126
-
127
-
128
-
129
-
130
-
131
-
132
-
133
-
134
-
135
-
136
-
137
-
138
-
139
-
140
-
141
-
142
-
143
-
144
-
145
-
146
-
147
-
148
-
149
-
150
-
151
-
152
-
153
-
154
-
155
-
156
-
157
-
158
-
159
-
160
-
161
-
162
-
163
-
164
-
165
-
166
-
167
-
168
-
169
-
170
-
171
-
172
-
173
-
174
-
175
-
176
-
177
-
178
-
179
-
180
-
181
-
182
-
183
-
184
-
185
-
186
-
187
-
188
-
189
-
190
-
191
-
192
-
193
-
194
-
195
-
196
-
197
-
198
-
199
-
200
-
201
-
202
-
203
-
204
-
205
-
206
-
207
-
208
-
209
-
210
-
211
-
212
-
213
-
214
-
215
-
216
-
217
-
218
-
219
-
220
-
221
-
222
-
223
-
224
-
225
-
226
-
227
-
228
-
229
-
230
-
231
-
232
-
233
-
234
-
235
-
236
-
237
-
238
-
239
-
240
-
241
-
242
-
243
-
244
-
245
-
246
-
247
-
248
-
249
-
250
-
251
-
252
-
253
-
254
-
255
-
256
-
257
-
258
-
259
-
260
-
261
-
262
-
263
-
264
-
265
-
266
-
267
-
268
-
269
-
270
-
271
-
272
-
273
-
274
-
275
-
276
 |
 |

Bank of America 2011 33
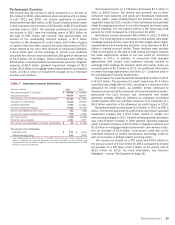
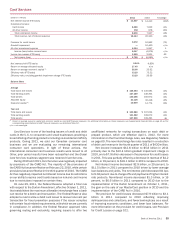
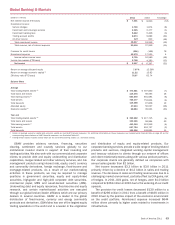
Core Net Interest Income
We manage core net interest income which is reported net interest
income on a FTE basis adjusted for the impact of market-based
activities. As discussed in the GBAM business segment section
on page 43, we evaluate our market-based results and strategies
on a total market-based revenue approach by combining net
interest income and noninterest income for GBAM. An analysis of
core net interest income, core average earning assets and core
net interest yield on earning assets, all of which adjust for the
impact of market-based activities from reported net interest
income on a FTE basis, is shown below. We believe the use of this
non-GAAP presentation in Table 9 provides additional clarity in
assessing our results.
Table 9
(Dollars in millions)
Net interest income (FTE basis)
As reported (1)
Impact of market-based net interest income (2)
Core net interest income
Average earning assets
As reported
Impact of market-based earning assets (2)
Core average earning assets
Net interest yield contribution (FTE basis)
As reported (1)
Impact of market-based activities (2)
Core net interest yield on earning assets
Core Net Interest Income
2011
$ 45,588
(3,813)
41,775
1,834,659
(448,776)
$ 1,385,883
2.48%
0.53
3.01%
2010
$ 52,693
(4,430)
48,263
1,897,573
(512,804)
$1,384,769
2.78%
0.71
3.49%
(1) Net interest income and net interest yield include fees earned on overnight deposits placed
with the Federal Reserve of $186 million and $368 million for 2011 and 2010.
(2) Represents the impact of market-based amounts included in GBAM.
Core net interest income decreased $6.5 billion to $41.8 billion
for 2011 compared to 2010. The decline was primarily due to
lower consumer loan balances and yields and decreased
investment security yields, including the acceleration of purchase
premium amortization from an increase in modeled prepayment
expectations and increased hedge ineffectiveness. These
decreases were partially offset by ongoing reductions in our debt
footprint and lower interest rates paid on deposits.
Core average earning assets increased $1.1 billion to $1,385.9
billion for 2011 compared to 2010. The increase was primarily
due to growth in investment securities partially offset by declines
in consumer loans.
Core net interest yield decreased 48 bps to 3.01 percent for
2011 compared to 2010 primarily due to the factors noted above.
In addition, the yield curve flattened significantly with long-term
rates near historical lows at December 31, 2011. This has resulted
in net interest yield compression as assets have repriced down
and liability yields have declined less significantly due to the
absolute low level of short-end rates.
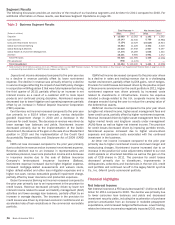
Business Segment Operations
Segment Description and Basis of Presentation
We report the results of our operations through six business
segments: Deposits, Card Services, CRES, Global Commercial
Banking, GBAM and GWIM, with the remaining operations recorded
in All Other.
We prepare and evaluate segment results using certain non-
GAAP financial measures, many of which are discussed in
Supplemental Financial Data on page 32. We begin by evaluating
the operating results of the segments which by definition exclude
merger and restructuring charges.
The management accounting and reporting process derives
segment and business results by utilizing allocation
methodologies for revenue and expense. The net income derived
for the businesses is dependent upon revenue and cost allocations
using an activity-based costing model, funds transfer pricing, and
other methodologies and assumptions management believes are
appropriate to reflect the results of the business.
Total revenue, net of interest expense, includes net interest
income on a FTE basis and noninterest income. The adjustment
of net interest income to a FTE basis results in a corresponding
increase in income tax expense. The segment results also reflect
certain revenue and expense methodologies that are utilized to
determine net income. The net interest income of the businesses
includes the results of a funds transfer pricing process that
matches assets and liabilities with similar interest rate sensitivity
and maturity characteristics. For presentation purposes, in
segments where the total of liabilities and equity exceeds assets,
which are generally deposit-taking segments, we allocate assets
to match liabilities. Net interest income of the business segments
also includes an allocation of net interest income generated by
certain of our ALM activities.
Our ALM activities include an overall interest rate risk
management strategy that incorporates the use of various
derivatives and cash instruments to manage fluctuations in
earnings and capital that are caused by interest rate volatility. Our
goal is to manage interest rate sensitivity so that movements in
interest rates do not significantly adversely affect earnings and
capital. The majority of our ALM activities are allocated to the
business segments and fluctuate based on performance. ALM
activities include external product pricing decisions including
deposit pricing strategies, the effects of our internal funds transfer
pricing process and the net effects of other ALM activities.
Certain expenses not directly attributable to a specific business
segment are allocated to the segments. The most significant of
these expenses include data and item processing costs and
certain centralized or shared functions. Data processing costs are
allocated to the segments based on equipment usage. Item
processing costs are allocated to the segments based on the
volume of items processed for each segment. The costs of certain
centralized or shared functions are allocated based on
methodologies that reflect utilization.
Equity is allocated to business segments and related
businesses using a risk-adjusted methodology incorporating each
segment’s credit, market, interest rate, strategic and operational
risk components. The nature of these risks is discussed further
on page 62. We benefit from the diversification of risk across these
components which is reflected as a reduction to allocated equity
for each segment. The total amount of average allocated equity
reflects both risk-based capital and the portion of goodwill and
intangibles specifically assigned to the business segments. The
risk-adjusted methodology is periodically refined and such
refinements are reflected as changes to allocated equity in each
segment.
For more information on selected financial information for the
business segments and reconciliations to consolidated total
revenue, net income (loss) and year-end total assets, see Note 26
– Business Segment Information to the Consolidated Financial
Statements.