Bank of America 2011 Annual Report Download - page 238
Download and view the complete annual report
Please find page 238 of the 2011 Bank of America annual report below. You can navigate through the pages in the report by either clicking on the pages listed below, or by using the keyword search tool below to find specific information within the annual report.-
 1
1 -
2
-
3
-
4
-
5
-
6
-
7
-
8
-
9
-
10
-
11
-
12
-
13
-
14
-
15
-
16
-
17
-
18
-
19
-
20
-
21
-
22
-
23
-
24
-
25
-
26
-
27
-
28
-
29
-
30
-
31
-
32
-
33
-
34
-
35
-
36
-
37
-
38
-
39
-
40
-
41
-
42
-
43
-
44
-
45
-
46
-
47
-
48
-
49
-
50
-
51
-
52
-
53
-
54
-
55
-
56
-
57
-
58
-
59
-
60
-
61
-
62
-
63
-
64
-
65
-
66
-
67
-
68
-
69
-
70
-
71
-
72
-
73
-
74
-
75
-
76
-
77
-
78
-
79
-
80
-
81
-
82
-
83
-
84
-
85
-
86
-
87
-
88
-
89
-
90
-
91
-
92
-
93
-
94
-
95
-
96
-
97
-
98
-
99
-
100
-
101
-
102
-
103
-
104
-
105
-
106
-
107
-
108
-
109
-
110
-
111
-
112
-
113
-
114
-
115
-
116
-
117
-
118
-
119
-
120
-
121
-
122
-
123
-
124
-
125
-
126
-
127
-
128
-
129
-
130
-
131
-
132
-
133
-
134
-
135
-
136
-
137
-
138
-
139
-
140
-
141
-
142
-
143
-
144
-
145
-
146
-
147
-
148
-
149
-
150
-
151
-
152
-
153
-
154
-
155
-
156
-
157
-
158
-
159
-
160
-
161
-
162
-
163
-
164
-
165
-
166
-
167
-
168
-
169
-
170
-
171
-
172
-
173
-
174
-
175
-
176
-
177
-
178
-
179
-
180
-
181
-
182
-
183
-
184
-
185
-
186
-
187
-
188
-
189
-
190
-
191
-
192
-
193
-
194
-
195
-
196
-
197
-
198
-
199
-
200
-
201
-
202
-
203
-
204
-
205
-
206
-
207
-
208
-
209
-
210
-
211
-
212
-
213
-
214
-
215
-
216
-
217
-
218
-
219
-
220
-
221
-
222
-
223
-
224
-
225
-
226
-
227
-
 228
228 -
 229
229 -
 230
230 -
 231
231 -
 232
232 -
 233
233 -
 234
234 -
 235
235 -
 236
236 -
 237
237 -
 238
238 -
 239
239 -
 240
240 -
 241
241 -
 242
242 -
 243
243 -
 244
244 -
 245
245 -
 246
246 -
 247
247 -
 248
248 -
249
-
250
-
251
-
252
-
253
-
254
-
255
-
256
-
257
-
258
-
259
-
260
-
261
-
262
-
263
-
264
-
265
-
266
-
267
-
268
-
269
-
270
-
271
-
272
-
273
-
274
-
275
-
276
 |
 |

236 Bank of America 2011
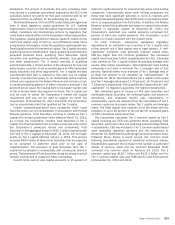
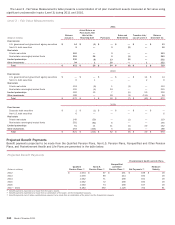
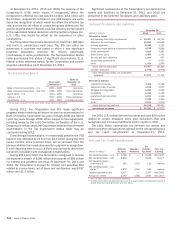
In addition to retirement pension benefits, full-time, salaried
employees and certain part-time employees may become eligible
to continue participation as retirees in health care and/or life
insurance plans sponsored by the Corporation. Based on the other
provisions of the individual plans, certain retirees may also have
the cost of these benefits partially paid by the Corporation. The
obligations assumed as a result of acquisitions are substantially
similar to the Corporation’s postretirement health and life plans,
except for Countrywide which did not have a postretirement health
and life plan. Collectively, these plans are referred to as the
Postretirement Health and Life Plans.
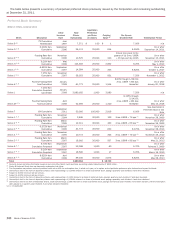
The Pension and Postretirement Plans table summarizes the
changes in the fair value of plan assets, changes in the projected
benefit obligation (PBO), the funded status of both the
accumulated benefit obligation (ABO) and the PBO, and the
weighted-average assumptions used to determine benefit
obligations for the pension plans and postretirement plans at
December 31, 2011 and 2010. Amounts recognized at December
31, 2011 and 2010 are reflected in other assets, and accrued
expenses and other liabilities on the Consolidated Balance Sheet.
The discount rate assumption is based on a cash flow matching
technique and is subject to change each year. This technique
utilizes yield curves that are based on Aa-rated corporate bonds
with cash flows that match estimated benefit payments of each
of the plans to produce the discount rate assumptions. The asset
valuation method for the Qualified Pension Plans recognizes 60
percent of the prior year’s market gains or losses at the next
measurement date with the remaining 40 percent spread equally
over the subsequent four years.
The Corporation’s best estimate of its contributions to be made
to the Non-U.S. Pension Plans, Nonqualified and Other Pension
Plans, and Postretirement Health and Life Plans in 2012 is $98
million, $124 million and $115 million, respectively. The
Corporation does not expect to make a contribution to the Qualified
Pension plans in 2012.
Pension and Postretirement Plans
(Dollars in millions)
Change in fair value of plan assets
Fair value, January 1
Actual return on plan assets
Company contributions
Plan participant contributions
Benefits paid
Plan transfer
Federal subsidy on benefits paid
Foreign currency exchange rate changes
Fair value, December 31
Change in projected benefit obligation
Projected benefit obligation, January 1
Service cost
Interest cost
Plan participant contributions
Plan amendments
Actuarial loss (gain)
Benefits paid
Plan transfer
Federal subsidy on benefits paid
Foreign currency exchange rate changes
Projected benefit obligation, December 31
Amount recognized, December 31
Funded status, December 31
Accumulated benefit obligation
Overfunded (unfunded) status of ABO
Provision for future salaries
Projected benefit obligation
Weighted-average assumptions, December 31
Discount rate
Rate of compensation increase
Qualified
Pension Plans (1)
2011
$ 15,648
182
—
—
(760)
—
n/a
n/a
$ 15,070
$ 13,938
423
746
—
(11)
555
(760)
—
n/a
n/a
$ 14,891
$ 179
$ 13,968
1,102
923
14,891
4.95%
4.00
2010
$ 14,527
1,835
—
—
(714)
—
n/a
n/a
$ 15,648
$ 13,048
397
748
—
—
459
(714)
—
n/a
n/a
$ 13,938
$ 1,710
$ 13,192
2,456
746
13,938
5.45%
4.00
Non-U.S.
Pension Plans (1)
2011
$ 1,691
295
104
3
(63)
10
n/a
(18)
$ 2,022
$ 1,916
43
99
3
2
(19)
(63)
15
n/a
(12)
$ 1,984
$38
$ 1,883
139
101
1,984
4.87%
4.42
2010
$ 1,522
166
99
2
(63)
—
n/a
(35)
$ 1,691
$ 1,813
32
95
2
2
78
(63)
—
n/a
(43)
$ 1,916
$ (225)
$ 1,781
(90)
135
1,916
5.32%
4.85
Nonqualified
and Other
Pension Plans (1)
2011
$ 2,689
493
99
—
(220)
—
n/a
n/a
$ 3,061
$ 3,078
3
152
—
—
124
(220)
—
n/a
—
$ 3,137
$ (76)
$ 3,135
(74)
2
3,137
4.65%
4.00
2010
$ 2,535
272
196
—
(314)
—
n/a
n/a
$ 2,689
$ 2,918
3
163
—
—
308
(314)
—
n/a
—
$ 3,078
$ (389)
$ 3,077
(388)
1
3,078
5.20%
4.00
Postretirement
Health and Life
Plans (1)
2011
$108
2
84
133
(255)
—
19
—
$91
$ 1,704
15
80
133
(21)
(56)
(255)
—
19
—
$ 1,619
$(1,528)
n/a
n/a
n/a
$ 1,619
4.65%
n/a
2010
$ 113
13
100
139
(275)
—
18
—
$ 108
$1,620
14
92
139
64
32
(275)
—
18
—
$1,704
$ (1,596)
n/a
n/a
n/a
$1,704
5.10%
n/a
(1) The measurement date for the Qualified Pension Plans, Non-U.S. Pension Plans, Nonqualified and Other Pension Plans, and Postretirement Health and Life Plans was December 31 of each year
reported.
n/a = not applicable