Bank of America 2011 Annual Report Download - page 80
Download and view the complete annual report
Please find page 80 of the 2011 Bank of America annual report below. You can navigate through the pages in the report by either clicking on the pages listed below, or by using the keyword search tool below to find specific information within the annual report.-
 1
1 -
2
-
3
-
4
-
5
-
6
-
7
-
8
-
9
-
10
-
11
-
12
-
13
-
14
-
15
-
16
-
17
-
18
-
19
-
20
-
21
-
22
-
23
-
24
-
25
-
26
-
27
-
28
-
29
-
30
-
31
-
32
-
33
-
34
-
35
-
36
-
37
-
38
-
39
-
40
-
41
-
42
-
43
-
44
-
45
-
46
-
47
-
48
-
49
-
50
-
51
-
52
-
53
-
54
-
55
-
56
-
57
-
58
-
59
-
60
-
61
-
62
-
63
-
64
-
65
-
66
-
67
-
68
-
69
-
 70
70 -
 71
71 -
 72
72 -
 73
73 -
 74
74 -
 75
75 -
 76
76 -
 77
77 -
 78
78 -
 79
79 -
 80
80 -
 81
81 -
 82
82 -
 83
83 -
 84
84 -
 85
85 -
 86
86 -
 87
87 -
 88
88 -
 89
89 -
 90
90 -
91
-
92
-
93
-
94
-
95
-
96
-
97
-
98
-
99
-
100
-
101
-
102
-
103
-
104
-
105
-
106
-
107
-
108
-
109
-
110
-
111
-
112
-
113
-
114
-
115
-
116
-
117
-
118
-
119
-
120
-
121
-
122
-
123
-
124
-
125
-
126
-
127
-
128
-
129
-
130
-
131
-
132
-
133
-
134
-
135
-
136
-
137
-
138
-
139
-
140
-
141
-
142
-
143
-
144
-
145
-
146
-
147
-
148
-
149
-
150
-
151
-
152
-
153
-
154
-
155
-
156
-
157
-
158
-
159
-
160
-
161
-
162
-
163
-
164
-
165
-
166
-
167
-
168
-
169
-
170
-
171
-
172
-
173
-
174
-
175
-
176
-
177
-
178
-
179
-
180
-
181
-
182
-
183
-
184
-
185
-
186
-
187
-
188
-
189
-
190
-
191
-
192
-
193
-
194
-
195
-
196
-
197
-
198
-
199
-
200
-
201
-
202
-
203
-
204
-
205
-
206
-
207
-
208
-
209
-
210
-
211
-
212
-
213
-
214
-
215
-
216
-
217
-
218
-
219
-
220
-
221
-
222
-
223
-
224
-
225
-
226
-
227
-
228
-
229
-
230
-
231
-
232
-
233
-
234
-
235
-
236
-
237
-
238
-
239
-
240
-
241
-
242
-
243
-
244
-
245
-
246
-
247
-
248
-
249
-
250
-
251
-
252
-
253
-
254
-
255
-
256
-
257
-
258
-
259
-
260
-
261
-
262
-
263
-
264
-
265
-
266
-
267
-
268
-
269
-
270
-
271
-
272
-
273
-
274
-
275
-
276
 |
 |

78 Bank of America 2011
Residential Mortgage
The residential mortgage portfolio, which for purposes of the
consumer credit portfolio discussion and related tables, excludes
the discontinued real estate portfolio acquired from Countrywide,
makes up the largest percentage of our consumer loan portfolio
at 43 percent of consumer loans at December 31, 2011.
Approximately 14 percent of the residential mortgage portfolio is
in GWIM and represents residential mortgages that are originated
for the home purchase and refinancing needs of our wealth
management clients. The remaining portion of the portfolio is
mostly in All Other and is comprised of both originated loans as
well as purchased loans used in our overall ALM activities.
Outstanding balances in the residential mortgage portfolio,
excluding $906 million of loans accounted for under the fair value
option, increased $4.3 billion at December 31, 2011 compared
to December 31, 2010 as new origination volume, the majority of
which is fully-insured, was partially offset by paydowns, charge-offs
and transfers to foreclosed properties. In addition, repurchases
of FHA delinquent loans pursuant to our servicing agreements with
GNMA also increased the residential mortgage portfolio during
2011. At December 31, 2011 and 2010, the residential mortgage
portfolio included $93.9 billion and $67.2 billion of outstanding
fully-insured loans. On this portion of the residential mortgage
portfolio, we are protected against principal loss as a result of FHA
insurance and long-term stand-by agreements with FNMA and
FHLMC. At December 31, 2011 and 2010, $24.0 billion and $20.1
billion were related to repurchases of FHA delinquent loans
pursuant to our servicing agreements with GNMA and the
remainder of the fully-insured portfolio represents originations that
were retained on-balance sheet.
At December 31, 2011 and 2010, principal balances of
$23.8 billion and $12.9 billion were protected by long-term stand-
by agreements. All of these loans are individually insured and
therefore the Corporation does not record an allowance for credit
losses.
In addition to the abovementioned long-term stand-by
agreements with FNMA and FHLMC, we have mitigated a portion
of our credit risk on the residential mortgage portfolio through the
use of synthetic securitization vehicles as described in Note 6 –
Outstanding Loans and Leases to the Consolidated Financial
Statements.
At December 31, 2011 and 2010, the synthetic securitization
vehicles referenced principal balances of $23.9 billion and $53.9
billion of residential mortgage loans and provided loss protection
up to $783 million and $1.1 billion. At December 31, 2011 and
2010, the Corporation had a receivable of $359 million and $722
million from these vehicles for reimbursement of losses. The
Corporation records an allowance for credit losses on loans
referenced by the synthetic securitization vehicles. The reported
net charge-offs for the residential mortgage portfolio do not include
the benefit of amounts reimbursable from these vehicles.
Adjusting for the benefit of the credit protection from the synthetic
securitizations, the residential mortgage net charge-off ratio,
excluding the Countrywide PCI and fully-insured loan portfolios, for
2011 would have been reduced by 13 bps and eight bps for 2010.
Synthetic securitizations and the long-term stand-by
agreements with FNMA and FHLMC together reduce our regulatory
risk-weighted assets due to the transfer of a portion of our credit
risk to unaffiliated parties. At December 31, 2011 and 2010, these
programs had the cumulative effect of reducing our risk-weighted
assets by $7.9 billion and $8.2 billion, increased our Tier 1 capital
ratio by eight bps and six bps, and our Tier 1 common capital ratio
by six bps and five bps.
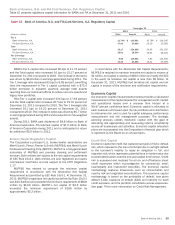
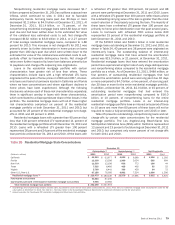
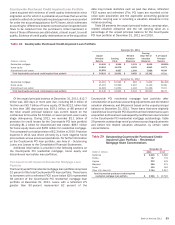
Table 24 presents certain residential mortgage key credit
statistics on both a reported basis and excluding the Countrywide
PCI loan portfolio, the fully-insured loan portfolio and loans
accounted for under the fair value option. We believe the
presentation of information adjusted to exclude these loan
portfolios is more representative of the credit risk in the residential
mortgage loan portfolio. As such, the following discussion
presents the residential mortgage portfolio excluding the
Countrywide PCI loan portfolio, the fully-insured loan portfolio and
loans accounted for under the fair value option. For more
information on the Countrywide PCI loan portfolio, see page 83.
Table 24
(Dollars in millions)
Outstandings
Accruing past due 30 days or more
Accruing past due 90 days or more
Nonperforming loans
Percent of portfolio
Refreshed LTV greater than 90 but less than 100
Refreshed LTV greater than 100
Refreshed FICO below 620
2006 and 2007 vintages (2)
Net charge-off ratio (3)
Residential Mortgage – Key Credit Statistics
December 31
Reported Basis (1)
2011
$ 262,290
28,688
21,164
15,970
15%
33
21
27
1.45
2010
$ 257,973
24,267
16,768
17,691
15%
32
20
32
1.49
Excluding Countrywide
Purchased Credit-impaired
and Fully-insured Loans
2011
$ 158,470
3,950
n/a
15,970
11%
26
15
37
2.27
2010
$ 180,136
5,117
n/a
17,691
11%
24
15
40
1.86
(1) Outstandings, accruing past due, nonperforming loans and percentages of portfolio exclude loans accounted for under the fair value option. There were no residential mortgage loans accounted for
under the fair value option at December 31, 2010. See Note 23 – Fair Value Option to the Consolidated Financial Statements for additional information on the fair value option.
(2) These vintages of loans account for 63 percent and 67 percent of nonperforming residential mortgage loans at December 31, 2011 and 2010. These vintages of loans accounted for 73 percent
and 77 percent of residential mortgage net charge-offs in 2011 and 2010.
(3) Net charge-off ratios are calculated as net charge-offs divided by average outstanding loans, excluding loans accounted for under the fair value option.
n/a = not applicable