Bank of America 2011 Annual Report Download - page 252
Download and view the complete annual report
Please find page 252 of the 2011 Bank of America annual report below. You can navigate through the pages in the report by either clicking on the pages listed below, or by using the keyword search tool below to find specific information within the annual report.-
 1
1 -
2
-
3
-
4
-
5
-
6
-
7
-
8
-
9
-
10
-
11
-
12
-
13
-
14
-
15
-
16
-
17
-
18
-
19
-
20
-
21
-
22
-
23
-
24
-
25
-
26
-
27
-
28
-
29
-
30
-
31
-
32
-
33
-
34
-
35
-
36
-
37
-
38
-
39
-
40
-
41
-
42
-
43
-
44
-
45
-
46
-
47
-
48
-
49
-
50
-
51
-
52
-
53
-
54
-
55
-
56
-
57
-
58
-
59
-
60
-
61
-
62
-
63
-
64
-
65
-
66
-
67
-
68
-
69
-
70
-
71
-
72
-
73
-
74
-
75
-
76
-
77
-
78
-
79
-
80
-
81
-
82
-
83
-
84
-
85
-
86
-
87
-
88
-
89
-
90
-
91
-
92
-
93
-
94
-
95
-
96
-
97
-
98
-
99
-
100
-
101
-
102
-
103
-
104
-
105
-
106
-
107
-
108
-
109
-
110
-
111
-
112
-
113
-
114
-
115
-
116
-
117
-
118
-
119
-
120
-
121
-
122
-
123
-
124
-
125
-
126
-
127
-
128
-
129
-
130
-
131
-
132
-
133
-
134
-
135
-
136
-
137
-
138
-
139
-
140
-
141
-
142
-
143
-
144
-
145
-
146
-
147
-
148
-
149
-
150
-
151
-
152
-
153
-
154
-
155
-
156
-
157
-
158
-
159
-
160
-
161
-
162
-
163
-
164
-
165
-
166
-
167
-
168
-
169
-
170
-
171
-
172
-
173
-
174
-
175
-
176
-
177
-
178
-
179
-
180
-
181
-
182
-
183
-
184
-
185
-
186
-
187
-
188
-
189
-
190
-
191
-
192
-
193
-
194
-
195
-
196
-
197
-
198
-
199
-
200
-
201
-
202
-
203
-
204
-
205
-
206
-
207
-
208
-
209
-
210
-
211
-
212
-
213
-
214
-
215
-
216
-
217
-
218
-
219
-
220
-
221
-
222
-
223
-
224
-
225
-
226
-
227
-
228
-
229
-
230
-
231
-
232
-
233
-
234
-
235
-
236
-
237
-
238
-
239
-
240
-
241
-
 242
242 -
 243
243 -
 244
244 -
 245
245 -
 246
246 -
 247
247 -
 248
248 -
 249
249 -
 250
250 -
 251
251 -
 252
252 -
 253
253 -
 254
254 -
 255
255 -
 256
256 -
 257
257 -
 258
258 -
 259
259 -
 260
260 -
 261
261 -
 262
262 -
263
-
264
-
265
-
266
-
267
-
268
-
269
-
270
-
271
-
272
-
273
-
274
-
275
-
276
 |
 |

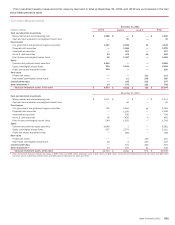
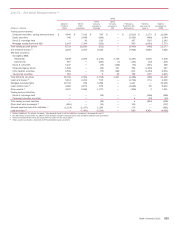
250 Bank of America 2011
(Dollars in millions)
Assets
Federal funds sold and securities borrowed or purchased under
agreements to resell
Trading account assets:
U.S. government and agency securities
Corporate securities, trading loans and other
Equity securities
Non-U.S. sovereign debt
Mortgage trading loans and ABS
Total trading account assets
Derivative assets (3)
AFS debt securities:
U.S. Treasury securities and agency securities
Mortgage-backed securities:
Agency
Agency-collateralized mortgage obligations
Non-agency residential
Non-agency commercial
Non-U.S. securities
Corporate/Agency bonds
Other taxable securities
Tax-exempt securities
Total AFS debt securities
Loans and leases
Mortgage servicing rights
Loans held-for-sale
Other assets
Total assets
Liabilities
Interest-bearing deposits in U.S. offices
Federal funds purchased and securities loaned or sold under
agreements to repurchase
Trading account liabilities:
U.S. government and agency securities
Equity securities
Non-U.S. sovereign debt
Corporate securities and other
Total trading account liabilities
Derivative liabilities (3)
Other short-term borrowings
Accrued expenses and other liabilities
Long-term debt
Total liabilities
December 31, 2010
Fair Value Measurements
Level 1 (1)
$—
28,237
732
23,249
24,934
—
77,152
2,627
46,003
—
—
—
—
1,440
—
20
—
47,463
—
—
—
32,624
$159,866
$—
—
23,357
14,568
14,748
224
52,897
1,799
—
31,470
—
$ 86,166
Level 2 (1)
$ 78,599
32,574
40,869
8,257
8,346
11,948
101,994
1,516,244
3,102
191,213
37,017
21,649
6,833
2,696
5,154
2,354
4,273
274,291
—
—
21,802
31,051
$ 2,023,981
$ 2,732
37,424
5,983
914
1,065
11,119
19,081
1,492,963
6,472
931
47,998
$ 1,607,601
Level 3
$—
—
7,751
623
243
6,908
15,525
18,773
—
4
—
1,468
19
3
137
13,018
1,224
15,873
3,321
14,900
4,140
6,856
$ 79,388
$—
—
—
—
—
7
7
11,028
706
828
2,986
$ 15,555
Netting
Adjustments (2)
$—
—
—
—
—
—
—
(1,464,644)
—
—
—
—
—
—
—
—
—
—
—
—
—
—
$ (1,464,644)
$—
—
—
—
—
—
—
(1,449,876)
—
—
—
$ (1,449,876)
Assets/Liabilities
at Fair Value
$ 78,599
60,811
49,352
32,129
33,523
18,856
194,671
73,000
49,105
191,217
37,017
23,117
6,852
4,139
5,291
15,392
5,497
337,627
3,321
14,900
25,942
70,531
$ 798,591
$ 2,732
37,424
29,340
15,482
15,813
11,350
71,985
55,914
7,178
33,229
50,984
$ 259,446
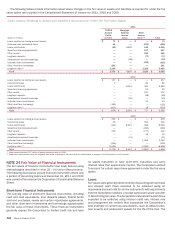
(1) Gross transfers between Level 1 and Level 2 were approximately $1.3 billion during 2010.
(2) Amounts represent the impact of legally enforceable master netting agreements and also cash collateral held or placed with the same counterparties.
(3) For further disaggregation of derivative assets and liabilities, see Note 4 – Derivatives.