Bank of America 2011 Annual Report Download - page 251
Download and view the complete annual report
Please find page 251 of the 2011 Bank of America annual report below. You can navigate through the pages in the report by either clicking on the pages listed below, or by using the keyword search tool below to find specific information within the annual report.-
 1
1 -
2
-
3
-
4
-
5
-
6
-
7
-
8
-
9
-
10
-
11
-
12
-
13
-
14
-
15
-
16
-
17
-
18
-
19
-
20
-
21
-
22
-
23
-
24
-
25
-
26
-
27
-
28
-
29
-
30
-
31
-
32
-
33
-
34
-
35
-
36
-
37
-
38
-
39
-
40
-
41
-
42
-
43
-
44
-
45
-
46
-
47
-
48
-
49
-
50
-
51
-
52
-
53
-
54
-
55
-
56
-
57
-
58
-
59
-
60
-
61
-
62
-
63
-
64
-
65
-
66
-
67
-
68
-
69
-
70
-
71
-
72
-
73
-
74
-
75
-
76
-
77
-
78
-
79
-
80
-
81
-
82
-
83
-
84
-
85
-
86
-
87
-
88
-
89
-
90
-
91
-
92
-
93
-
94
-
95
-
96
-
97
-
98
-
99
-
100
-
101
-
102
-
103
-
104
-
105
-
106
-
107
-
108
-
109
-
110
-
111
-
112
-
113
-
114
-
115
-
116
-
117
-
118
-
119
-
120
-
121
-
122
-
123
-
124
-
125
-
126
-
127
-
128
-
129
-
130
-
131
-
132
-
133
-
134
-
135
-
136
-
137
-
138
-
139
-
140
-
141
-
142
-
143
-
144
-
145
-
146
-
147
-
148
-
149
-
150
-
151
-
152
-
153
-
154
-
155
-
156
-
157
-
158
-
159
-
160
-
161
-
162
-
163
-
164
-
165
-
166
-
167
-
168
-
169
-
170
-
171
-
172
-
173
-
174
-
175
-
176
-
177
-
178
-
179
-
180
-
181
-
182
-
183
-
184
-
185
-
186
-
187
-
188
-
189
-
190
-
191
-
192
-
193
-
194
-
195
-
196
-
197
-
198
-
199
-
200
-
201
-
202
-
203
-
204
-
205
-
206
-
207
-
208
-
209
-
210
-
211
-
212
-
213
-
214
-
215
-
216
-
217
-
218
-
219
-
220
-
221
-
222
-
223
-
224
-
225
-
226
-
227
-
228
-
229
-
230
-
231
-
232
-
233
-
234
-
235
-
236
-
237
-
238
-
239
-
240
-
 241
241 -
 242
242 -
 243
243 -
 244
244 -
 245
245 -
 246
246 -
 247
247 -
 248
248 -
 249
249 -
 250
250 -
 251
251 -
 252
252 -
 253
253 -
 254
254 -
 255
255 -
 256
256 -
 257
257 -
 258
258 -
 259
259 -
 260
260 -
 261
261 -
262
-
263
-
264
-
265
-
266
-
267
-
268
-
269
-
270
-
271
-
272
-
273
-
274
-
275
-
276
 |
 |

Bank of America 2011 249
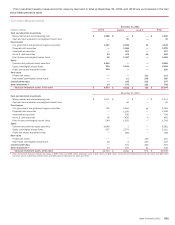
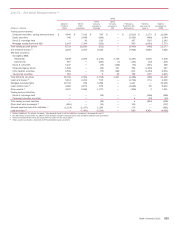
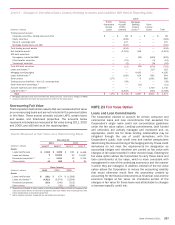
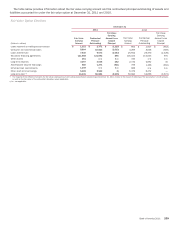
Recurring Fair Value
Assets and liabilities carried at fair value on a recurring basis at December 31, 2011 and 2010, including financial instruments which
the Corporation accounts for under the fair value option, are summarized in the following tables.
(Dollars in millions)
Assets
Federal funds sold and securities borrowed or purchased under
agreements to resell
Trading account assets:
U.S. government and agency securities
Corporate securities, trading loans and other
Equity securities
Non-U.S. sovereign debt
Mortgage trading loans and ABS
Total trading account assets
Derivative assets (3)
AFS debt securities:
U.S. Treasury securities and agency securities
Mortgage-backed securities:
Agency
Agency-collateralized mortgage obligations
Non-agency residential
Non-agency commercial
Non-U.S. securities
Corporate/Agency bonds
Other taxable securities
Tax-exempt securities
Total AFS debt securities
Loans and leases
Mortgage servicing rights
Loans held-for-sale
Other assets
Total assets
Liabilities
Interest-bearing deposits in U.S. offices
Federal funds purchased and securities loaned or sold under
agreements to repurchase
Trading account liabilities:
U.S. government and agency securities
Equity securities
Non-U.S. sovereign debt
Corporate securities and other
Total trading account liabilities
Derivative liabilities (3)
Other short-term borrowings
Accrued expenses and other liabilities
Long-term debt
Total liabilities
December 31, 2011
Fair Value Measurements
Level 1 (1)
$—
30,540
1,067
17,181
33,667
—
82,455
2,186
39,389
—
—
—
—
1,664
—
20
—
41,073
—
—
—
18,963
$ 144,677
$—
—
19,120
13,259
16,760
829
49,968
2,055
—
13,832
—
$ 65,855
Level 2 (1)
$ 87,453
22,073
28,624
5,949
8,937
9,826
75,409
1,865,310
3,475
142,526
44,999
13,907
5,482
3,256
2,873
8,593
1,955
227,066
6,060
—
4,243
13,886
$ 2,279,427
$ 3,297
34,235
1,590
1,335
680
6,821
10,426
1,850,804
6,558
1,897
43,296
$ 1,950,513
Level 3
$—
—
6,880
544
342
3,689
11,455
14,366
—
37
—
860
40
—
162
4,265
2,648
8,012
2,744
7,378
3,387
4,235
$ 51,577
$—
—
—
—
—
114
114
8,500
—
14
2,943
$ 11,571
Netting
Adjustments (2)
$—
—
—
—
—
—
—
(1,808,839)
—
—
—
—
—
—
—
—
—
—
—
—
—
—
$ (1,808,839)
$—
—
—
—
—
—
—
(1,801,839)
—
—
—
$ (1,801,839)
Assets/Liabilities
at Fair Value
$ 87,453
52,613
36,571
23,674
42,946
13,515
169,319
73,023
42,864
142,563
44,999
14,767
5,522
4,920
3,035
12,878
4,603
276,151
8,804
7,378
7,630
37,084
$ 666,842
$ 3,297
34,235
20,710
14,594
17,440
7,764
60,508
59,520
6,558
15,743
46,239
$ 226,100
(1) Gross transfers between Level 1 and Level 2 were not significant during 2011.
(2) Amounts represent the impact of legally enforceable master netting agreements and also cash collateral held or placed with the same counterparties.
(3) For further disaggregation of derivative assets and liabilities, see Note 4 – Derivatives.