Bank of America 2011 Annual Report Download - page 39
Download and view the complete annual report
Please find page 39 of the 2011 Bank of America annual report below. You can navigate through the pages in the report by either clicking on the pages listed below, or by using the keyword search tool below to find specific information within the annual report.-
 1
1 -
2
-
3
-
4
-
5
-
6
-
7
-
8
-
9
-
10
-
11
-
12
-
13
-
14
-
15
-
16
-
17
-
18
-
19
-
20
-
21
-
22
-
23
-
24
-
25
-
26
-
27
-
28
-
 29
29 -
 30
30 -
 31
31 -
 32
32 -
 33
33 -
 34
34 -
 35
35 -
 36
36 -
 37
37 -
 38
38 -
 39
39 -
 40
40 -
 41
41 -
 42
42 -
 43
43 -
 44
44 -
 45
45 -
 46
46 -
 47
47 -
 48
48 -
 49
49 -
50
-
51
-
52
-
53
-
54
-
55
-
56
-
57
-
58
-
59
-
60
-
61
-
62
-
63
-
64
-
65
-
66
-
67
-
68
-
69
-
70
-
71
-
72
-
73
-
74
-
75
-
76
-
77
-
78
-
79
-
80
-
81
-
82
-
83
-
84
-
85
-
86
-
87
-
88
-
89
-
90
-
91
-
92
-
93
-
94
-
95
-
96
-
97
-
98
-
99
-
100
-
101
-
102
-
103
-
104
-
105
-
106
-
107
-
108
-
109
-
110
-
111
-
112
-
113
-
114
-
115
-
116
-
117
-
118
-
119
-
120
-
121
-
122
-
123
-
124
-
125
-
126
-
127
-
128
-
129
-
130
-
131
-
132
-
133
-
134
-
135
-
136
-
137
-
138
-
139
-
140
-
141
-
142
-
143
-
144
-
145
-
146
-
147
-
148
-
149
-
150
-
151
-
152
-
153
-
154
-
155
-
156
-
157
-
158
-
159
-
160
-
161
-
162
-
163
-
164
-
165
-
166
-
167
-
168
-
169
-
170
-
171
-
172
-
173
-
174
-
175
-
176
-
177
-
178
-
179
-
180
-
181
-
182
-
183
-
184
-
185
-
186
-
187
-
188
-
189
-
190
-
191
-
192
-
193
-
194
-
195
-
196
-
197
-
198
-
199
-
200
-
201
-
202
-
203
-
204
-
205
-
206
-
207
-
208
-
209
-
210
-
211
-
212
-
213
-
214
-
215
-
216
-
217
-
218
-
219
-
220
-
221
-
222
-
223
-
224
-
225
-
226
-
227
-
228
-
229
-
230
-
231
-
232
-
233
-
234
-
235
-
236
-
237
-
238
-
239
-
240
-
241
-
242
-
243
-
244
-
245
-
246
-
247
-
248
-
249
-
250
-
251
-
252
-
253
-
254
-
255
-
256
-
257
-
258
-
259
-
260
-
261
-
262
-
263
-
264
-
265
-
266
-
267
-
268
-
269
-
270
-
271
-
272
-
273
-
274
-
275
-
276
 |
 |

Bank of America 2011 37
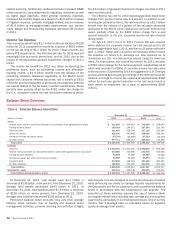
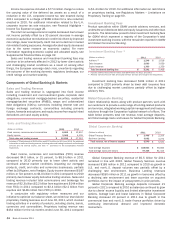
Consumer Real Estate Services
(Dollars in millions)
Net interest income (FTE basis)
Noninterest income:
Mortgage banking income (loss)
Insurance income
All other income
Total noninterest income (loss)
Total revenue, net of interest expense
Provision for credit losses
Goodwill impairment
All other noninterest expense
Income (loss) before income taxes
Income tax expense (benefit) (FTE basis)
Net income (loss)
Net interest yield (FTE basis)
Efficiency ratio (FTE basis)
Balance Sheet
Average
Total loans and leases
Total earning assets
Total assets
Allocated equity
Economic capital (1)
Year end
Total loans and leases
Total earning assets
Total assets
2011
Home Loans
$ 1,964
3,330
750
959
5,039
7,003
234
—
5,649
1,120
416
$ 704
2.78%
80.67
$ 54,784
70,612
72,785
n/a
n/a
$ 52,369
58,822
61,417
Legacy
Asset
Servicing
$ 1,324
(12,176)
—
123
(12,053)
(10,729)
4,290
—
13,642
(28,661)
(10,689)
$ (17,972)
1.96%
n/m
$ 65,036
67,518
83,140
n/a
n/a
$ 59,990
63,331
79,023
Other
$ (81)
653
—
—
653
572
—
2,603
(1)
(2,030)
231
$ (2,261)
(0.48)%
n/m
$—
16,760
34,442
n/a
n/a
$—
10,228
23,272
Total
Consumer
Real Estate
Services
$ 3,207
(8,193)
750
1,082
(6,361)
(3,154)
4,524
2,603
19,290
(29,571)
(10,042)
$ (19,529)
2.07%
n/m
$ 119,820
154,890
190,367
16,202
14,852
$ 112,359
132,381
163,712
2010
$ 4,662
3,164
2,061
442
5,667
10,329
8,490
2,000
12,886
(13,047)
(4,100)
$ (8,947)
2.52%
n/m
$129,234
185,344
224,994
26,016
21,214
$ 122,933
172,082
212,412
% Change
(31)%
n/m
(64)
145
n/m
n/m
(47)
30
50
127
145
118
(7)
(16)
(15)
(38)
(30)
(9)
(23)
(23)
(1) Average economic capital is a non-GAAP financial measure. For additional information on these measures, see Supplemental Financial Data on page 32 and for corresponding reconciliations to GAAP
financial measures, see Statistical Table XVI.
n/m = not meaningful
n/a = not applicable
CRES was realigned effective January 1, 2011 and its activities
are now referred to as Home Loans, Legacy Asset Servicing and
Other. This realignment allows CRES management to lead the
ongoing home loan business while also providing greater focus
and transparency on legacy mortgage issues.
CRES generates revenue by providing an extensive line of
consumer real estate products and services to customers
nationwide. CRES products include fixed- and adjustable-rate first-
lien mortgage loans for home purchase and refinancing needs,
home equity lines of credit (HELOC) and home equity loans. First
mortgage products are either sold into the secondary mortgage
market to investors, while we retain MSRs and the Bank of America
customer relationships, or are held on our balance sheet in All
Other for ALM purposes. HELOC and home equity loans are
retained on the CRES balance sheet. CRES services mortgage
loans, including those loans it owns, loans owned by other
business segments and All Other, and loans owned by outside
investors.
The financial results of the on-balance sheet loans are reported
in the business segment that owns the loans or All Other. CRES
is not impacted by the Corporation’s first mortgage production
retention decisions as CRES is compensated for loans held for
ALM purposes on a management accounting basis, with a
corresponding offset recorded in All Other, and for servicing loans
owned by other business segments and All Other.
CRES includes the impact of transferring customers and their
related loan balances between GWIM and CRES based on client
segmentation thresholds. For more information on the migration
of customer balances, see GWIM on page 46.
Home Loans
Home Loans products are available to our customers through our
retail network of approximately 5,700 banking centers, mortgage
loan officers in approximately 500 locations and a sales force
offering our customers direct telephone and online access to our
products. These products were also offered through our
correspondent lending channel; however, we exited this channel
in late 2011. In 2011, we also exited the reverse mortgage
origination business. In October 2010, we exited the first
mortgage wholesale acquisition channel. These strategic changes
were made to allow greater focus on our direct to consumer
channels, deepen relationships with existing customers and use
mortgage products to acquire new relationships.