Bank of America 2011 Annual Report Download - page 247
Download and view the complete annual report
Please find page 247 of the 2011 Bank of America annual report below. You can navigate through the pages in the report by either clicking on the pages listed below, or by using the keyword search tool below to find specific information within the annual report.-
 1
1 -
2
-
3
-
4
-
5
-
6
-
7
-
8
-
9
-
10
-
11
-
12
-
13
-
14
-
15
-
16
-
17
-
18
-
19
-
20
-
21
-
22
-
23
-
24
-
25
-
26
-
27
-
28
-
29
-
30
-
31
-
32
-
33
-
34
-
35
-
36
-
37
-
38
-
39
-
40
-
41
-
42
-
43
-
44
-
45
-
46
-
47
-
48
-
49
-
50
-
51
-
52
-
53
-
54
-
55
-
56
-
57
-
58
-
59
-
60
-
61
-
62
-
63
-
64
-
65
-
66
-
67
-
68
-
69
-
70
-
71
-
72
-
73
-
74
-
75
-
76
-
77
-
78
-
79
-
80
-
81
-
82
-
83
-
84
-
85
-
86
-
87
-
88
-
89
-
90
-
91
-
92
-
93
-
94
-
95
-
96
-
97
-
98
-
99
-
100
-
101
-
102
-
103
-
104
-
105
-
106
-
107
-
108
-
109
-
110
-
111
-
112
-
113
-
114
-
115
-
116
-
117
-
118
-
119
-
120
-
121
-
122
-
123
-
124
-
125
-
126
-
127
-
128
-
129
-
130
-
131
-
132
-
133
-
134
-
135
-
136
-
137
-
138
-
139
-
140
-
141
-
142
-
143
-
144
-
145
-
146
-
147
-
148
-
149
-
150
-
151
-
152
-
153
-
154
-
155
-
156
-
157
-
158
-
159
-
160
-
161
-
162
-
163
-
164
-
165
-
166
-
167
-
168
-
169
-
170
-
171
-
172
-
173
-
174
-
175
-
176
-
177
-
178
-
179
-
180
-
181
-
182
-
183
-
184
-
185
-
186
-
187
-
188
-
189
-
190
-
191
-
192
-
193
-
194
-
195
-
196
-
197
-
198
-
199
-
200
-
201
-
202
-
203
-
204
-
205
-
206
-
207
-
208
-
209
-
210
-
211
-
212
-
213
-
214
-
215
-
216
-
217
-
218
-
219
-
220
-
221
-
222
-
223
-
224
-
225
-
226
-
227
-
228
-
229
-
230
-
231
-
232
-
233
-
234
-
235
-
236
-
 237
237 -
 238
238 -
 239
239 -
 240
240 -
 241
241 -
 242
242 -
 243
243 -
 244
244 -
 245
245 -
 246
246 -
 247
247 -
 248
248 -
 249
249 -
 250
250 -
 251
251 -
 252
252 -
 253
253 -
 254
254 -
 255
255 -
 256
256 -
 257
257 -
258
-
259
-
260
-
261
-
262
-
263
-
264
-
265
-
266
-
267
-
268
-
269
-
270
-
271
-
272
-
273
-
274
-
275
-
276
 |
 |

Bank of America 2011 245
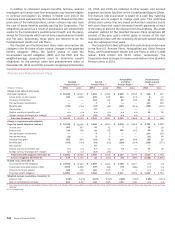
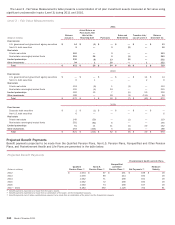
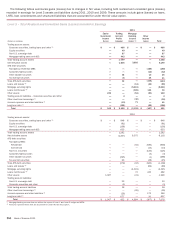
NOTE 21 Income Taxes
The components of income tax expense (benefit) for 2011, 2010
and 2009 were as presented in the table below.
Income Tax Expense (Benefit)
(Dollars in millions)
Current income tax expense (benefit)
U.S. federal
U.S. state and local
Non-U.S.
Total current expense (benefit)
Deferred income tax expense (benefit)
U.S. federal
U.S. state and local
Non-U.S.
Total deferred expense (benefit)
Total income tax expense (benefit)
2011
$ (733)
393
613
273
(2,673)
(584)
1,308
(1,949)
$ (1,676)
2010
$ (666)
158
815
307
(287)
201
694
608
$ 915
2009
$ (3,576)
555
735
(2,286)
792
(620)
198
370
$ (1,916)
Total income tax expense (benefit) does not reflect the deferred
tax effects of unrealized gains and losses on AFS debt and
marketable equity securities, foreign currency translation
adjustments, derivatives and employee benefit plan adjustments
that are included in accumulated OCI. As a result of these tax
effects, accumulated OCI increased $3.0 billion in 2011 and
decreased $3.2 billion and $1.6 billion in 2010 and 2009. In
addition, total income tax expense (benefit) does not reflect tax
effects associated with the Corporation’s employee stock plans
which increased common stock and additional paid-in capital $19
million in 2011 and decreased common stock and additional paid-
in capital $98 million and $295 million in 2010 and 2009.
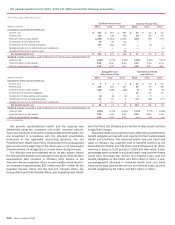
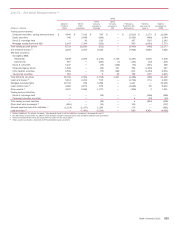
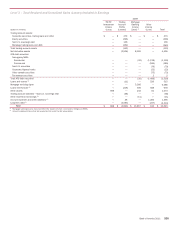
Income tax expense (benefit) for 2011, 2010 and 2009 varied
from the amount computed by applying the statutory income tax
rate to income (loss) before income taxes. A reconciliation between
the expected U.S. federal income tax expense using the federal
statutory tax rate of 35 percent to the Corporation’s actual income
tax expense (benefit) and resulting effective tax rate for 2011,
2010 and 2009 is presented in the Reconciliation of Income Tax
Expense (Benefit) table.
Reconciliation of Income Tax Expense (Benefit)
(Dollars in millions)
Expected U.S. federal income tax expense (benefit)
Increase (decrease) in taxes resulting from:
State tax expense (benefit), net of federal effect
Change in federal and non-U.S. valuation allowances
Subsidiary sales and liquidations
Low-income housing credits/other credits
Tax-exempt income, including dividends
Non-U.S. tax differential
Changes in prior period UTBs (including interest)
Goodwill - impairment and other
Non-U.S. statutory rate reductions
Leveraged lease tax differential
Nondeductible expenses
Other
Total income tax expense (benefit)
2011
Amount
$ (81)
(124)
(1,102)
(823)
(800)
(614)
(383)
(239)
1,420
860
121
119
(30)
$(1,676)
Percent
35.0 %
(10)%
n/m
2010
Amount
$ (463)
233
(1,657)
—
(732)
(981)
(190)
(349)
4,508
392
98
99
(43)
$ 915
Percent
35.0 %
(17.6)
125.4
—
55.4
74.2
14.4
26.4
(341.0)
(29.7)
(7.4)
(7.5)
3.2
(69.2)%
2009
Amount
$ 1,526
(42)
(650)
(595)
(668)
(863)
(709)
87
—
—
59
69
(130)
$ (1,916)
Percent
35.0 %
(1.0)
(14.9)
(13.7)
(15.3)
(19.8)
(16.3)
2.0
—
—
1.4
1.6
(3.0)
(44.0)%
n/m = not meaningful
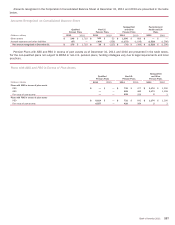
The reconciliation of the beginning unrecognized tax benefits (UTB) balance to the ending balance is presented in the table below.
Reconciliation of the Change in Unrecognized Tax Benefits
(Dollars in millions)
Beginning balance
Increases related to positions taken during the current year
Positions acquired or assumed in business combinations
Increases related to positions taken during prior years (1)
Decreases related to positions taken during prior years (1)
Settlements
Expiration of statute of limitations
Ending balance
2011
$ 5,169
219
—
879
(1,669)
(277)
(118)
$ 4,203
2010
$ 5,253
172
—
755
(657)
(305)
(49)
$ 5,169
2009
$ 3,541
181
1,924
791
(554)
(615)
(15)
$ 5,253
(1) The sum per year of positions taken during prior years differs from the $(239) million, $(349) million and $87 million in the Reconciliation of Income Tax Expense (Benefit) table due to temporary
items and jurisdictional offsets, as well as the inclusion of interest in the Reconciliation of Income Tax Expense (Benefit) table.