Bank of America 2011 Annual Report Download - page 137
Download and view the complete annual report
Please find page 137 of the 2011 Bank of America annual report below. You can navigate through the pages in the report by either clicking on the pages listed below, or by using the keyword search tool below to find specific information within the annual report.-
 1
1 -
2
-
3
-
4
-
5
-
6
-
7
-
8
-
9
-
10
-
11
-
12
-
13
-
14
-
15
-
16
-
17
-
18
-
19
-
20
-
21
-
22
-
23
-
24
-
25
-
26
-
27
-
28
-
29
-
30
-
31
-
32
-
33
-
34
-
35
-
36
-
37
-
38
-
39
-
40
-
41
-
42
-
43
-
44
-
45
-
46
-
47
-
48
-
49
-
50
-
51
-
52
-
53
-
54
-
55
-
56
-
57
-
58
-
59
-
60
-
61
-
62
-
63
-
64
-
65
-
66
-
67
-
68
-
69
-
70
-
71
-
72
-
73
-
74
-
75
-
76
-
77
-
78
-
79
-
80
-
81
-
82
-
83
-
84
-
85
-
86
-
87
-
88
-
89
-
90
-
91
-
92
-
93
-
94
-
95
-
96
-
97
-
98
-
99
-
100
-
101
-
102
-
103
-
104
-
105
-
106
-
107
-
108
-
109
-
110
-
111
-
112
-
113
-
114
-
115
-
116
-
117
-
118
-
119
-
120
-
121
-
122
-
123
-
124
-
125
-
126
-
 127
127 -
 128
128 -
 129
129 -
 130
130 -
 131
131 -
 132
132 -
 133
133 -
 134
134 -
 135
135 -
 136
136 -
 137
137 -
 138
138 -
 139
139 -
 140
140 -
 141
141 -
 142
142 -
 143
143 -
 144
144 -
 145
145 -
 146
146 -
 147
147 -
148
-
149
-
150
-
151
-
152
-
153
-
154
-
155
-
156
-
157
-
158
-
159
-
160
-
161
-
162
-
163
-
164
-
165
-
166
-
167
-
168
-
169
-
170
-
171
-
172
-
173
-
174
-
175
-
176
-
177
-
178
-
179
-
180
-
181
-
182
-
183
-
184
-
185
-
186
-
187
-
188
-
189
-
190
-
191
-
192
-
193
-
194
-
195
-
196
-
197
-
198
-
199
-
200
-
201
-
202
-
203
-
204
-
205
-
206
-
207
-
208
-
209
-
210
-
211
-
212
-
213
-
214
-
215
-
216
-
217
-
218
-
219
-
220
-
221
-
222
-
223
-
224
-
225
-
226
-
227
-
228
-
229
-
230
-
231
-
232
-
233
-
234
-
235
-
236
-
237
-
238
-
239
-
240
-
241
-
242
-
243
-
244
-
245
-
246
-
247
-
248
-
249
-
250
-
251
-
252
-
253
-
254
-
255
-
256
-
257
-
258
-
259
-
260
-
261
-
262
-
263
-
264
-
265
-
266
-
267
-
268
-
269
-
270
-
271
-
272
-
273
-
274
-
275
-
276
 |
 |

Bank of America 2011 135
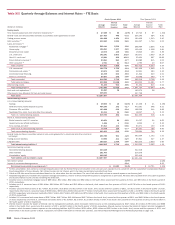
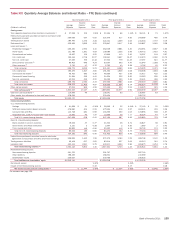
Table XIII Quarterly Average Balances and Interest Rates – FTE Basis (continued)
(Dollars in millions)
Earning assets
Time deposits placed and other short-term investments (1)
Federal funds sold and securities borrowed or purchased under
agreements to resell
Trading account assets
Debt securities (2)
Loans and leases (3):
Residential mortgage (4)
Home equity
Discontinued real estate
U.S. credit card
Non-U.S. credit card
Direct/Indirect consumer (5)
Other consumer (6)
Total consumer
U.S. commercial
Commercial real estate (7)
Commercial lease financing
Non-U.S. commercial
Total commercial
Total loans and leases
Other earning assets
Total earning assets (8)
Cash and cash equivalents (1)
Other assets, less allowance for loan and lease losses
Total assets
Interest-bearing liabilities
U.S. interest-bearing deposits:
Savings
NOW and money market deposit accounts
Consumer CDs and IRAs
Negotiable CDs, public funds and other time deposits
Total U.S. interest-bearing deposits
Non-U.S. interest-bearing deposits:
Banks located in non-U.S. countries
Governments and official institutions
Time, savings and other
Total non-U.S. interest-bearing deposits
Total interest-bearing deposits
Federal funds purchased, securities loaned or sold under
agreements to repurchase and other short-term borrowings
Trading account liabilities
Long-term debt
Total interest-bearing liabilities (8)
Noninterest-bearing sources:
Noninterest-bearing deposits
Other liabilities
Shareholders’ equity
Total liabilities and shareholders’ equity
Net interest spread
Impact of noninterest-bearing sources
Net interest income/yield on earning assets (1)
Second Quarter 2011
Average
Balance
$ 27,298
259,069
186,760
335,269
265,420
131,786
15,997
106,164
27,259
89,403
2,745
638,774
190,479
45,762
21,284
42,214
299,739
938,513
97,616
1,844,525
115,956
378,629
$ 2,339,110
$ 41,668
478,690
113,728
13,842
647,928
19,234
2,131
64,889
86,254
734,182
338,692
96,108
435,144
1,604,126
301,762
198,155
235,067
$ 2,339,110
Interest
Income/
Expense
$ 106
597
1,576
2,696
2,763
1,261
129
2,718
760
945
47
8,623
1,827
382
235
339
2,783
11,406
866
17,247
49
$31
304
281
42
658
37
2
146
185
843
1,342
627
2,991
5,803
$ 11,444
Yield/
Rate
1.56%
0.92
3.38
3.22
4.16
3.83
3.22
10.27
11.18
4.24
6.76
5.41
3.85
3.35
4.41
3.22
3.72
4.87
3.56
3.75
0.30%
0.25
0.99
1.22
0.41
0.77
0.38
0.90
0.86
0.46
1.59
2.62
2.75
1.45
2.30%
0.19
2.49%
First Quarter 2011
Average
Balance
$ 31,294
227,379
221,041
335,847
262,049
136,089
12,899
109,941
27,633
90,097
2,753
641,461
191,353
48,359
21,634
36,159
297,505
938,966
115,336
1,869,863
138,241
330,434
$2,338,538
$ 38,905
475,954
118,306
13,995
647,160
21,534
2,307
60,432
84,273
731,433
371,573
83,914
440,511
1,627,431
291,707
188,631
230,769
$2,338,538
Interest
Income/
Expense
$88
517
1,669
2,917
2,881
1,335
110
2,837
779
993
45
8,980
1,926
437
322
299
2,984
11,964
922
18,077
63
$32
316
300
39
687
38
2
112
152
839
1,184
627
3,093
5,743
$ 12,334
Yield/
Rate
1.14%
0.92
3.05
3.49
4.40
3.96
3.42
10.47
11.43
4.47
6.58
5.65
4.08
3.66
5.95
3.35
4.06
5.14
3.24
3.92
0.34%
0.27
1.03
1.11
0.43
0.72
0.35
0.76
0.73
0.46
1.29
3.03
2.84
1.43
2.49%
0.17
2.66%
Fourth Quarter 2010
Average
Balance
$28,141
243,589
216,003
341,867
254,051
139,772
13,297
112,673
27,457
91,549
2,796
641,595
193,608
51,617
21,363
32,431
299,019
940,614
113,325
1,883,539
136,967
349,752
$2,370,258
$37,145
464,531
124,855
16,334
642,865
16,827
1,560
58,746
77,133
719,998
369,738
81,313
465,875
1,636,924
287,740
210,069
235,525
$2,370,258
Interest
Income/
Expense
$7
5
486
1,710
3,065
2,857
1,410
118
3,040
815
1,088
45
9,373
1,894
432
250
289
2,865
12,238
923
18,497
63
$35
333
338
47
753
38
2
101
141
894
1,142
561
3,254
5,851
$12,646
Yield/
Rate
1.07%
0.79
3.15
3.58
4.50
4.01
3.57
10.70
11.77
4.72
6.32
5.81
3.88
3.32
4.69
3.53
3.81
5.18
3.23
3.90
0.36%
0.28
1.07
1.16
0.46
0.91
0.42
0.69
0.73
0.49
1.23
2.74
2.78
1.42
2.48%
0.18
2.66%
For footnotes see page 134.