Bank of America 2011 Annual Report Download - page 99
Download and view the complete annual report
Please find page 99 of the 2011 Bank of America annual report below. You can navigate through the pages in the report by either clicking on the pages listed below, or by using the keyword search tool below to find specific information within the annual report.-
 1
1 -
2
-
3
-
4
-
5
-
6
-
7
-
8
-
9
-
10
-
11
-
12
-
13
-
14
-
15
-
16
-
17
-
18
-
19
-
20
-
21
-
22
-
23
-
24
-
25
-
26
-
27
-
28
-
29
-
30
-
31
-
32
-
33
-
34
-
35
-
36
-
37
-
38
-
39
-
40
-
41
-
42
-
43
-
44
-
45
-
46
-
47
-
48
-
49
-
50
-
51
-
52
-
53
-
54
-
55
-
56
-
57
-
58
-
59
-
60
-
61
-
62
-
63
-
64
-
65
-
66
-
67
-
68
-
69
-
70
-
71
-
72
-
73
-
74
-
75
-
76
-
77
-
78
-
79
-
80
-
81
-
82
-
83
-
84
-
85
-
86
-
87
-
88
-
 89
89 -
 90
90 -
 91
91 -
 92
92 -
 93
93 -
 94
94 -
 95
95 -
 96
96 -
 97
97 -
 98
98 -
 99
99 -
 100
100 -
 101
101 -
 102
102 -
 103
103 -
 104
104 -
 105
105 -
 106
106 -
 107
107 -
 108
108 -
 109
109 -
110
-
111
-
112
-
113
-
114
-
115
-
116
-
117
-
118
-
119
-
120
-
121
-
122
-
123
-
124
-
125
-
126
-
127
-
128
-
129
-
130
-
131
-
132
-
133
-
134
-
135
-
136
-
137
-
138
-
139
-
140
-
141
-
142
-
143
-
144
-
145
-
146
-
147
-
148
-
149
-
150
-
151
-
152
-
153
-
154
-
155
-
156
-
157
-
158
-
159
-
160
-
161
-
162
-
163
-
164
-
165
-
166
-
167
-
168
-
169
-
170
-
171
-
172
-
173
-
174
-
175
-
176
-
177
-
178
-
179
-
180
-
181
-
182
-
183
-
184
-
185
-
186
-
187
-
188
-
189
-
190
-
191
-
192
-
193
-
194
-
195
-
196
-
197
-
198
-
199
-
200
-
201
-
202
-
203
-
204
-
205
-
206
-
207
-
208
-
209
-
210
-
211
-
212
-
213
-
214
-
215
-
216
-
217
-
218
-
219
-
220
-
221
-
222
-
223
-
224
-
225
-
226
-
227
-
228
-
229
-
230
-
231
-
232
-
233
-
234
-
235
-
236
-
237
-
238
-
239
-
240
-
241
-
242
-
243
-
244
-
245
-
246
-
247
-
248
-
249
-
250
-
251
-
252
-
253
-
254
-
255
-
256
-
257
-
258
-
259
-
260
-
261
-
262
-
263
-
264
-
265
-
266
-
267
-
268
-
269
-
270
-
271
-
272
-
273
-
274
-
275
-
276
 |
 |

Bank of America 2011 97
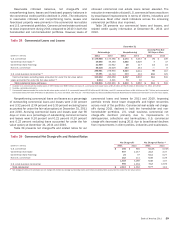
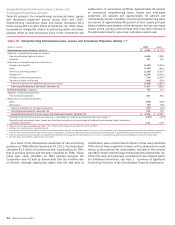
Risk Mitigation
We purchase credit protection to cover the funded portion as well
as the unfunded portion of certain credit exposures. To lower the
cost of obtaining our desired credit protection levels, credit
exposure may be added within an industry, borrower or
counterparty group by selling protection.
At December 31, 2011 and 2010, net notional credit default
protection purchased in our credit derivatives portfolio to hedge
our funded and unfunded exposures for which we elected the fair
value option, as well as certain other credit exposures, was $19.4
billion and $20.1 billion. The mark-to-market effects, including the
cost of net credit default protection hedging our credit exposure,
resulted in net gains of $121 million in 2011 compared to net
losses of $546 million in 2010.
The average VaR for these credit derivative hedges was $60
million in 2011 compared to $53 million in 2010. The average
VaR for the related credit exposure was $74 million in 2011
compared to $65 million in 2010. There is a diversification effect
between the net credit default protection hedging our credit
exposure and the related credit exposure such that the combined
average VaR was $38 million in 2011 compared to $41 million in
2010. See Trading Risk Management on page 107 for a description
of our VaR calculation for the market-based trading portfolio.
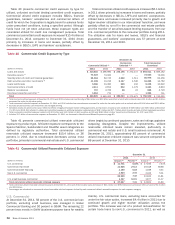
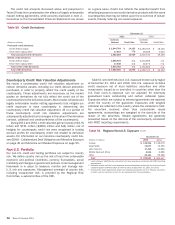
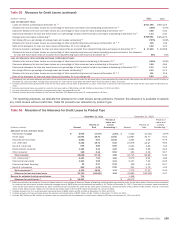
Tables 48 and 49 present the maturity profiles and the credit
exposure debt ratings of the net credit default protection portfolio
at December 31, 2011 and 2010. The distribution of debt ratings
for net notional credit default protection purchased is shown as a
negative amount.
Table 48
Less than or equal to one year
Greater than one year and less than or equal to five years
Greater than five years
Total net credit default protection
Net Credit Default Protection by Maturity Profile
December 31
2011
16%
77
7
100%
2010
14%
80
6
100%
Table 49
(Dollars in millions)
Ratings (1, 2)
AAA
AA
A
BBB
BB
B
CCC and below
NR (3)
Total net credit default protection
Net Credit Default Protection by Credit Exposure Debt Rating
December 31
2011
Net
Notional
$ (32)
(779)
(7,184)
(7,436)
(1,527)
(1,534)
(661)
(203)
$ (19,356)
Percent of
Total
0.2%
4.0
37.1
38.4
7.9
7.9
3.4
1.1
100.0%
2010
Net
Notional
$—
(188)
(6,485)
(7,731)
(2,106)
(1,260)
(762)
(1,586)
$ (20,118)
Percent of
Total
—%
0.9
32.2
38.4
10.5
6.3
3.8
7.9
100.0%
(1) Ratings are refreshed on a quarterly basis.
(2) The Corporation considers ratings of BBB- or higher to meet the definition of investment grade.
(3) In addition to names which have not been rated, “NR” includes $(15) million and $(1.5) billion in net credit default swap index positions at December 31, 2011 and 2010. While index positions are
principally investment grade, credit default swap indices include names in and across each of the ratings categories.
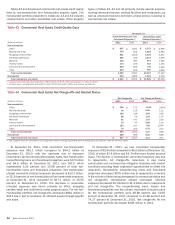
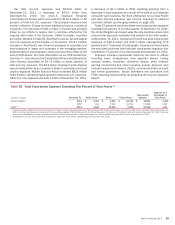
In addition to our net notional credit default protection
purchased to cover the funded and unfunded portion of certain
credit exposures, credit derivatives are used for market-making
activities for clients and establishing positions intended to profit
from directional or relative value changes. We execute the majority
of our credit derivative trades in the OTC market with large,
multinational financial institutions, including broker/dealers and,
to a lesser degree, with a variety of other investors. Because these
transactions are executed in the OTC market, we are subject to
settlement risk. We are also subject to credit risk in the event that
these counterparties fail to perform under the terms of these
contracts. In most cases, credit derivative transactions are
executed on a daily margin basis. Therefore, events such as a
credit downgrade, depending on the ultimate rating level, or a
breach of credit covenants would typically require an increase in
the amount of collateral required of the counterparty, where
applicable, and/or allow us to take additional protective measures
such as early termination of all trades.
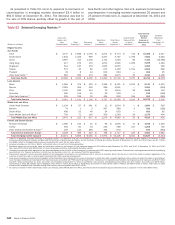
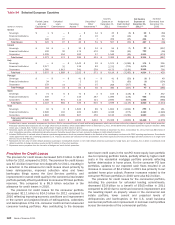
Table 50 presents the total contract/notional amount of credit
derivatives outstanding and includes both purchased and written
credit derivatives. The credit risk amounts are measured as the
net replacement cost in the event the counterparties with contracts
in a gain position to us fail to perform under the terms of those
contracts. For information on our written credit derivatives, see
Note 4 – Derivatives to the Consolidated Financial Statements.