Bank of America 2011 Annual Report Download - page 149
Download and view the complete annual report
Please find page 149 of the 2011 Bank of America annual report below. You can navigate through the pages in the report by either clicking on the pages listed below, or by using the keyword search tool below to find specific information within the annual report.-
 1
1 -
2
-
3
-
4
-
5
-
6
-
7
-
8
-
9
-
10
-
11
-
12
-
13
-
14
-
15
-
16
-
17
-
18
-
19
-
20
-
21
-
22
-
23
-
24
-
25
-
26
-
27
-
28
-
29
-
30
-
31
-
32
-
33
-
34
-
35
-
36
-
37
-
38
-
39
-
40
-
41
-
42
-
43
-
44
-
45
-
46
-
47
-
48
-
49
-
50
-
51
-
52
-
53
-
54
-
55
-
56
-
57
-
58
-
59
-
60
-
61
-
62
-
63
-
64
-
65
-
66
-
67
-
68
-
69
-
70
-
71
-
72
-
73
-
74
-
75
-
76
-
77
-
78
-
79
-
80
-
81
-
82
-
83
-
84
-
85
-
86
-
87
-
88
-
89
-
90
-
91
-
92
-
93
-
94
-
95
-
96
-
97
-
98
-
99
-
100
-
101
-
102
-
103
-
104
-
105
-
106
-
107
-
108
-
109
-
110
-
111
-
112
-
113
-
114
-
115
-
116
-
117
-
118
-
119
-
120
-
121
-
122
-
123
-
124
-
125
-
126
-
127
-
128
-
129
-
130
-
131
-
132
-
133
-
134
-
135
-
136
-
137
-
138
-
 139
139 -
 140
140 -
 141
141 -
 142
142 -
 143
143 -
 144
144 -
 145
145 -
 146
146 -
 147
147 -
 148
148 -
 149
149 -
 150
150 -
 151
151 -
 152
152 -
 153
153 -
 154
154 -
 155
155 -
 156
156 -
 157
157 -
 158
158 -
 159
159 -
160
-
161
-
162
-
163
-
164
-
165
-
166
-
167
-
168
-
169
-
170
-
171
-
172
-
173
-
174
-
175
-
176
-
177
-
178
-
179
-
180
-
181
-
182
-
183
-
184
-
185
-
186
-
187
-
188
-
189
-
190
-
191
-
192
-
193
-
194
-
195
-
196
-
197
-
198
-
199
-
200
-
201
-
202
-
203
-
204
-
205
-
206
-
207
-
208
-
209
-
210
-
211
-
212
-
213
-
214
-
215
-
216
-
217
-
218
-
219
-
220
-
221
-
222
-
223
-
224
-
225
-
226
-
227
-
228
-
229
-
230
-
231
-
232
-
233
-
234
-
235
-
236
-
237
-
238
-
239
-
240
-
241
-
242
-
243
-
244
-
245
-
246
-
247
-
248
-
249
-
250
-
251
-
252
-
253
-
254
-
255
-
256
-
257
-
258
-
259
-
260
-
261
-
262
-
263
-
264
-
265
-
266
-
267
-
268
-
269
-
270
-
271
-
272
-
273
-
274
-
275
-
276
 |
 |

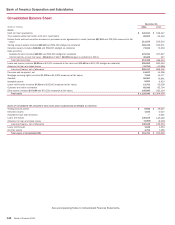
Bank of America 2011 147
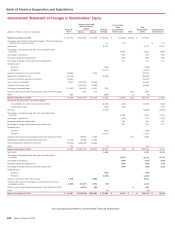
Bank of America Corporation and Subsidiaries
Consolidated Statement of Income
(Dollars in millions, except per share information)
Interest income
Loans and leases
Debt securities
Federal funds sold and securities borrowed or purchased under agreements to resell
Trading account assets
Other interest income
Total interest income
Interest expense
Deposits
Short-term borrowings
Trading account liabilities
Long-term debt
Total interest expense
Net interest income
Noninterest income
Card income
Service charges
Investment and brokerage services
Investment banking income
Equity investment income
Trading account profits
Mortgage banking income (loss)
Insurance income
Gains on sales of debt securities
Other income (loss)
Other-than-temporary impairment losses on available-for-sale debt securities:
Total other-than-temporary impairment losses
Less: Portion of other-than-temporary impairment losses recognized in other comprehensive income
Net impairment losses recognized in earnings on available-for-sale debt securities
Total noninterest income
Total revenue, net of interest expense
Provision for credit losses
Noninterest expense
Personnel
Occupancy
Equipment
Marketing
Professional fees
Amortization of intangibles
Data processing
Telecommunications
Other general operating
Goodwill impairment
Merger and restructuring charges
Total noninterest expense
Income (loss) before income taxes
Income tax expense (benefit)
Net income (loss)
Preferred stock dividends and accretion
Net income (loss) applicable to common shareholders
Per common share information
Earnings (loss)
Diluted earnings (loss)
Dividends paid
Average common shares issued and outstanding (in thousands)
Average diluted common shares issued and outstanding (in thousands)
2011
$ 44,966
9,521
2,147
5,961
3,641
66,236
3,002
4,599
2,212
11,807
21,620
44,616
7,184
8,094
11,826
5,217
7,360
6,697
(8,830)
1,346
3,374
6,869
(360)
61
(299)
48,838
93,454
13,410
36,965
4,748
2,340
2,203
3,381
1,509
2,652
1,553
21,101
3,184
638
80,274
(230)
(1,676)
$ 1,446
1,361
$85
$0.01
0.01
0.04
10,142,625
10,254,824
2010
$ 50,996
11,667
1,832
6,841
4,161
75,497
3,997
3,699
2,571
13,707
23,974
51,523
8,108
9,390
11,622
5,520
5,260
10,054
2,734
2,066
2,526
2,384
(2,174)
1,207
(967)
58,697
110,220
28,435
35,149
4,716
2,452
1,963
2,695
1,731
2,544
1,416
16,222
12,400
1,820
83,108
(1,323)
915
$ (2,238)
1,357
$(3,595)
$(0.37)
(0.37)
0.04
9,790,472
9,790,472
2009
$ 48,703
12,947
2,894
7,944
5,428
77,916
7,807
5,512
2,075
15,413
30,807
47,109
8,353
11,038
11,919
5,551
10,014
12,235
8,791
2,760
4,723
(14)
(3,508)
672
(2,836)
72,534
119,643
48,570
31,528
4,906
2,455
1,933
2,281
1,978
2,500
1,420
14,991
—
2,721
66,713
4,360
(1,916)
$ 6,276
8,480
$ (2,204)
$ (0.29)
(0.29)
0.04
7,728,570
7,728,570
See accompanying Notes to Consolidated Financial Statements.