Bank of America 2011 Annual Report Download - page 42
Download and view the complete annual report
Please find page 42 of the 2011 Bank of America annual report below. You can navigate through the pages in the report by either clicking on the pages listed below, or by using the keyword search tool below to find specific information within the annual report.-
 1
1 -
2
-
3
-
4
-
5
-
6
-
7
-
8
-
9
-
10
-
11
-
12
-
13
-
14
-
15
-
16
-
17
-
18
-
19
-
20
-
21
-
22
-
23
-
24
-
25
-
26
-
27
-
28
-
29
-
30
-
31
-
 32
32 -
 33
33 -
 34
34 -
 35
35 -
 36
36 -
 37
37 -
 38
38 -
 39
39 -
 40
40 -
 41
41 -
 42
42 -
 43
43 -
 44
44 -
 45
45 -
 46
46 -
 47
47 -
 48
48 -
 49
49 -
 50
50 -
 51
51 -
 52
52 -
53
-
54
-
55
-
56
-
57
-
58
-
59
-
60
-
61
-
62
-
63
-
64
-
65
-
66
-
67
-
68
-
69
-
70
-
71
-
72
-
73
-
74
-
75
-
76
-
77
-
78
-
79
-
80
-
81
-
82
-
83
-
84
-
85
-
86
-
87
-
88
-
89
-
90
-
91
-
92
-
93
-
94
-
95
-
96
-
97
-
98
-
99
-
100
-
101
-
102
-
103
-
104
-
105
-
106
-
107
-
108
-
109
-
110
-
111
-
112
-
113
-
114
-
115
-
116
-
117
-
118
-
119
-
120
-
121
-
122
-
123
-
124
-
125
-
126
-
127
-
128
-
129
-
130
-
131
-
132
-
133
-
134
-
135
-
136
-
137
-
138
-
139
-
140
-
141
-
142
-
143
-
144
-
145
-
146
-
147
-
148
-
149
-
150
-
151
-
152
-
153
-
154
-
155
-
156
-
157
-
158
-
159
-
160
-
161
-
162
-
163
-
164
-
165
-
166
-
167
-
168
-
169
-
170
-
171
-
172
-
173
-
174
-
175
-
176
-
177
-
178
-
179
-
180
-
181
-
182
-
183
-
184
-
185
-
186
-
187
-
188
-
189
-
190
-
191
-
192
-
193
-
194
-
195
-
196
-
197
-
198
-
199
-
200
-
201
-
202
-
203
-
204
-
205
-
206
-
207
-
208
-
209
-
210
-
211
-
212
-
213
-
214
-
215
-
216
-
217
-
218
-
219
-
220
-
221
-
222
-
223
-
224
-
225
-
226
-
227
-
228
-
229
-
230
-
231
-
232
-
233
-
234
-
235
-
236
-
237
-
238
-
239
-
240
-
241
-
242
-
243
-
244
-
245
-
246
-
247
-
248
-
249
-
250
-
251
-
252
-
253
-
254
-
255
-
256
-
257
-
258
-
259
-
260
-
261
-
262
-
263
-
264
-
265
-
266
-
267
-
268
-
269
-
270
-
271
-
272
-
273
-
274
-
275
-
276
 |
 |

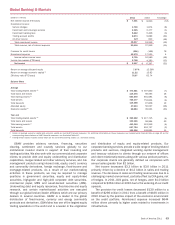
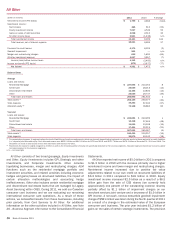
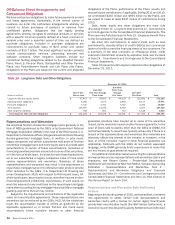
40 Bank of America 2011
Key Statistics
(Dollars in millions, except as noted)
Loan production
CRES:
First mortgage
Home equity
Total Corporation (1):
First mortgage
Home equity
Year end
Mortgage servicing portfolio (in billions) (2, 3)
Mortgage loans serviced for investors
(in billions) (3)
Mortgage servicing rights:
Balance
Capitalized mortgage servicing rights
(% of loans serviced for investors)
2011
$ 139,273
3,694
151,756
4,388
$ 1,763
1,379
7,378
54
bps
2010
$ 287,236
7,626
298,038
8,437
$ 2,057
1,628
14,900
92
bps
(1) In addition to loan production in CRES, the remaining first mortgage and home equity loan
production is primarily in GWIM.
(2) Servicing of residential mortgage loans, home equity lines of credit, home equity loans and
discontinued real estate mortgage loans.
(3) The total Corporation mortgage servicing portfolio included $1,029 billion in Home Loans and
$734 billion in Legacy Asset Servicing at December 31, 2011. The total Corporation mortgage
loans serviced for investors included $831 billion in Home Loans and $548 billion in Legacy
Asset Servicing at December 31, 2011.
First mortgage production was $151.8 billion in 2011
compared to $298.0 billion in 2010 with the decrease primarily
due to a reduction in both the correspondent and retail sales
channels. Additionally, the overall industry market demand for
mortgages dropped by approximately 17 percent in 2011,
contributing to the decline in mortgage production. We expect our
market share of mortgage originations in 2012 to be lower than
our market share in 2011, due to our exit from the correspondent
channel.
Home equity production was $4.4 billion in 2011 compared to
$8.4 billion in 2010 with the decrease primarily due to a decline
in reverse mortgage originations based on our decision to exit this
business in 2011.
At December 31, 2011, the consumer MSR balance was $7.4
billion, which represented 54 bps of the related unpaid principal
balance compared to $14.9 billion or 92 bps of the related unpaid
principal balance at December 31, 2010. The decline in the
consumer MSR balance was primarily driven by lower mortgage
rates, which resulted in higher forecasted prepayment speeds
combined with the impact of elevated expected costs to service
delinquent loans, which reduced expected cash flows and the value
of the MSRs, and MSR sales. In addition, the MSRs declined as
a result of customer payments. These declines were partially offset
by adjustments to prepayment models to reflect muted refinancing
activity relative to historic norms and by the addition of new MSRs
recorded in connection with sales of loans. During 2011, MSRs
in the amount of $896 million were sold. Gains recognized on
these transactions were not significant. These sales were
undertaken to reduce the balance of MSRs, lower our default-
related servicing costs and reduce risk in certain portfolios in
preparation of the implementation of Basel III. For additional
information on Basel III, see Capital Management – Regulatory
Capital Changes on page 67 and for information on MSRs and the
related hedge instruments, see Mortgage Banking Risk
Management on page 113 and Note 25 – Mortgage Servicing Rights
to the Consolidated Financial Statements.