Bank of America 2011 Annual Report Download - page 23
Download and view the complete annual report
Please find page 23 of the 2011 Bank of America annual report below. You can navigate through the pages in the report by either clicking on the pages listed below, or by using the keyword search tool below to find specific information within the annual report.-
 1
1 -
2
-
3
-
4
-
5
-
6
-
7
-
8
-
9
-
10
-
11
-
12
-
 13
13 -
 14
14 -
 15
15 -
 16
16 -
 17
17 -
 18
18 -
 19
19 -
 20
20 -
 21
21 -
 22
22 -
 23
23 -
 24
24 -
 25
25 -
 26
26 -
 27
27 -
 28
28 -
 29
29 -
 30
30 -
 31
31 -
 32
32 -
 33
33 -
34
-
35
-
36
-
37
-
38
-
39
-
40
-
41
-
42
-
43
-
44
-
45
-
46
-
47
-
48
-
49
-
50
-
51
-
52
-
53
-
54
-
55
-
56
-
57
-
58
-
59
-
60
-
61
-
62
-
63
-
64
-
65
-
66
-
67
-
68
-
69
-
70
-
71
-
72
-
73
-
74
-
75
-
76
-
77
-
78
-
79
-
80
-
81
-
82
-
83
-
84
-
85
-
86
-
87
-
88
-
89
-
90
-
91
-
92
-
93
-
94
-
95
-
96
-
97
-
98
-
99
-
100
-
101
-
102
-
103
-
104
-
105
-
106
-
107
-
108
-
109
-
110
-
111
-
112
-
113
-
114
-
115
-
116
-
117
-
118
-
119
-
120
-
121
-
122
-
123
-
124
-
125
-
126
-
127
-
128
-
129
-
130
-
131
-
132
-
133
-
134
-
135
-
136
-
137
-
138
-
139
-
140
-
141
-
142
-
143
-
144
-
145
-
146
-
147
-
148
-
149
-
150
-
151
-
152
-
153
-
154
-
155
-
156
-
157
-
158
-
159
-
160
-
161
-
162
-
163
-
164
-
165
-
166
-
167
-
168
-
169
-
170
-
171
-
172
-
173
-
174
-
175
-
176
-
177
-
178
-
179
-
180
-
181
-
182
-
183
-
184
-
185
-
186
-
187
-
188
-
189
-
190
-
191
-
192
-
193
-
194
-
195
-
196
-
197
-
198
-
199
-
200
-
201
-
202
-
203
-
204
-
205
-
206
-
207
-
208
-
209
-
210
-
211
-
212
-
213
-
214
-
215
-
216
-
217
-
218
-
219
-
220
-
221
-
222
-
223
-
224
-
225
-
226
-
227
-
228
-
229
-
230
-
231
-
232
-
233
-
234
-
235
-
236
-
237
-
238
-
239
-
240
-
241
-
242
-
243
-
244
-
245
-
246
-
247
-
248
-
249
-
250
-
251
-
252
-
253
-
254
-
255
-
256
-
257
-
258
-
259
-
260
-
261
-
262
-
263
-
264
-
265
-
266
-
267
-
268
-
269
-
270
-
271
-
272
-
273
-
274
-
275
-
276
 |
 |

Bank of America 2011 21
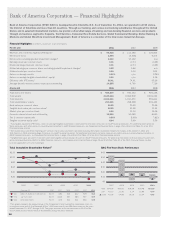
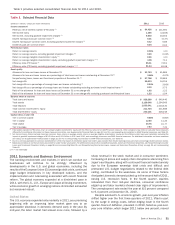
Table 1 provides selected consolidated financial data for 2011 and 2010.
Table 1
(Dollars in millions, except per share information)
Income statement
Revenue, net of interest expense (FTE basis) (1)
Net income (loss)
Net income, excluding goodwill impairment charges (2)
Diluted earnings (loss) per common share (3)
Diluted earnings per common share, excluding goodwill impairment charges (2)
Dividends paid per common share
Performance ratios
Return on average assets
Return on average assets, excluding goodwill impairment charges (2)
Return on average tangible shareholders’ equity (1)
Return on average tangible shareholders’ equity, excluding goodwill impairment charges (1, 2)
Efficiency ratio (FTE basis) (1)
Efficiency ratio (FTE basis), excluding goodwill impairment charges (1, 2)
Asset quality
Allowance for loan and lease losses at December 31
Allowance for loan and lease losses as a percentage of total loans and leases outstanding at December 31 (4)
Nonperforming loans, leases and foreclosed properties at December 31 (4)
Net charge-offs
Net charge-offs as a percentage of average loans and leases outstanding (4)
Net charge-offs as a percentage of average loans and leases outstanding excluding purchased credit-impaired loans (4)
Ratio of the allowance for loan and lease losses at December 31 to net charge-offs
Ratio of the allowance for loan and lease losses at December 31 to net charge-offs excluding purchased credit-impaired loans
Balance sheet at year end
Total loans and leases
Total assets
Total deposits
Total common shareholders’ equity
Total shareholders’ equity
Capital ratios at year end
Tier 1 common capital
Tier 1 capital
Total capital
Tier 1 leverage
Selected Financial Data
2011
$94,426
1,446
4,630
0.01
0.32
0.04
0.06%
0.20
0.96
3.08
85.01
81.64
$33,783
3.68%
$27,708
20,833
2.24%
2.32
1.62
1.22
$ 926,200
2,129,046
1,033,041
211,704
230,101
9.86%
12.40
16.75
7.53
2010
$ 111,390
(2,238)
10,162
(0.37)
0.86
0.04
n/m
0.42%
n/m
7.11
74.61
63.48
$ 41,885
4.47%
$ 32,664
34,334
3.60%
3.73
1.22
1.04
$ 940,440
2,264,909
1,010,430
211,686
228,248
8.60%
11.24
15.77
7.21
(1) Fully taxable-equivalent (FTE) basis, return on average tangible shareholders’ equity and the efficiency ratio are non-GAAP financial measures. Other companies may define or calculate these measures
differently. For additional information on these measures and ratios, see Supplemental Financial Data on page 32, and for a corresponding reconciliation to GAAP financial measures, see Table XV.
(2) Net income (loss), diluted earnings (loss) per common share, return on average assets, return on average tangible shareholders’ equity and the efficiency ratio have been calculated excluding the
impact of goodwill impairment charges of $3.2 billion and $12.4 billion in 2011 and 2010, and accordingly, these are non-GAAP financial measures. For additional information on these measures
and ratios, see Supplemental Financial Data on page 32, and for a corresponding reconciliation to GAAP financial measures, see Table XV.
(3) Due to a net loss applicable to common shareholders in 2010, the impact of antidilutive equity instruments was excluded from diluted earnings (loss) per share and average diluted common shares.
(4) Balances and ratios do not include loans accounted for under the fair value option. For additional exclusions from nonperforming loans, leases and foreclosed properties, see Nonperforming Consumer
Loans and Foreclosed Properties Activity on page 86 and corresponding Table 36, and Nonperforming Commercial Loans, Leases and Foreclosed Properties Activity on page 94 and corresponding
Table 45.
n/m = not meaningful
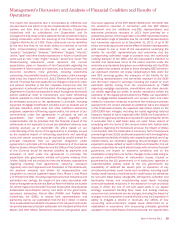
2011 Economic and Business Environment
The banking environment and markets in which we conduct our
businesses will continue to be strongly influenced by
developments in the U.S. and global economies, including the
results of the European Union (EU) sovereign debt crisis, continued
large budget imbalances in key developed nations, and the
implementation and rulemaking associated with recent financial
reform. The global economy expanded at a diminished pace in
2011, with the U.S., U.K., Europe and Japan all losing momentum,
while economic growth in emerging nations diminished somewhat
but remained robust.
United States
The U.S. economy expanded only modestly in 2011, as a promising
beginning with an improving labor market gave way to an
appreciable slowdown in domestic demand early in the year. By
mid-year, the labor market had slowed once more, followed by a
sharp reversal in the stock market and in consumer sentiment.
Increasing oil prices and supply chain disruptions stemming from
Japan’s earthquake, along with continued financial market anxiety
due to the European sovereign debt crisis and difficult and
protracted U.S. budget negotiations related to the federal debt
ceiling, contributed to the weakness. As some of these factors
dissipated, domestic demand picked up in the second half of 2011,
easing U.S. recession fears. In the fourth quarter, equities
rebounded from their mid-year declines, consumer confidence
edged up and labor markets showed clear signs of improvement.
The unemployment rate ended the year at 8.5 percent compared
to 9.4 percent at December 31, 2010.
Despite subdued U.S. economic growth, year-over-year inflation
drifted higher over the first three quarters of 2011, lifted in part
by the surge in energy costs, before edging lower in the fourth
quarter. Fears of deflation, prevalent in 2010, faded as year-over-
year core inflation, which began 2011 below one percent, moved