Bank of America 2011 Annual Report Download - page 37
Download and view the complete annual report
Please find page 37 of the 2011 Bank of America annual report below. You can navigate through the pages in the report by either clicking on the pages listed below, or by using the keyword search tool below to find specific information within the annual report.-
 1
1 -
2
-
3
-
4
-
5
-
6
-
7
-
8
-
9
-
10
-
11
-
12
-
13
-
14
-
15
-
16
-
17
-
18
-
19
-
20
-
21
-
22
-
23
-
24
-
25
-
26
-
 27
27 -
 28
28 -
 29
29 -
 30
30 -
 31
31 -
 32
32 -
 33
33 -
 34
34 -
 35
35 -
 36
36 -
 37
37 -
 38
38 -
 39
39 -
 40
40 -
 41
41 -
 42
42 -
 43
43 -
 44
44 -
 45
45 -
 46
46 -
 47
47 -
48
-
49
-
50
-
51
-
52
-
53
-
54
-
55
-
56
-
57
-
58
-
59
-
60
-
61
-
62
-
63
-
64
-
65
-
66
-
67
-
68
-
69
-
70
-
71
-
72
-
73
-
74
-
75
-
76
-
77
-
78
-
79
-
80
-
81
-
82
-
83
-
84
-
85
-
86
-
87
-
88
-
89
-
90
-
91
-
92
-
93
-
94
-
95
-
96
-
97
-
98
-
99
-
100
-
101
-
102
-
103
-
104
-
105
-
106
-
107
-
108
-
109
-
110
-
111
-
112
-
113
-
114
-
115
-
116
-
117
-
118
-
119
-
120
-
121
-
122
-
123
-
124
-
125
-
126
-
127
-
128
-
129
-
130
-
131
-
132
-
133
-
134
-
135
-
136
-
137
-
138
-
139
-
140
-
141
-
142
-
143
-
144
-
145
-
146
-
147
-
148
-
149
-
150
-
151
-
152
-
153
-
154
-
155
-
156
-
157
-
158
-
159
-
160
-
161
-
162
-
163
-
164
-
165
-
166
-
167
-
168
-
169
-
170
-
171
-
172
-
173
-
174
-
175
-
176
-
177
-
178
-
179
-
180
-
181
-
182
-
183
-
184
-
185
-
186
-
187
-
188
-
189
-
190
-
191
-
192
-
193
-
194
-
195
-
196
-
197
-
198
-
199
-
200
-
201
-
202
-
203
-
204
-
205
-
206
-
207
-
208
-
209
-
210
-
211
-
212
-
213
-
214
-
215
-
216
-
217
-
218
-
219
-
220
-
221
-
222
-
223
-
224
-
225
-
226
-
227
-
228
-
229
-
230
-
231
-
232
-
233
-
234
-
235
-
236
-
237
-
238
-
239
-
240
-
241
-
242
-
243
-
244
-
245
-
246
-
247
-
248
-
249
-
250
-
251
-
252
-
253
-
254
-
255
-
256
-
257
-
258
-
259
-
260
-
261
-
262
-
263
-
264
-
265
-
266
-
267
-
268
-
269
-
270
-
271
-
272
-
273
-
274
-
275
-
276
 |
 |

Bank of America 2011 35
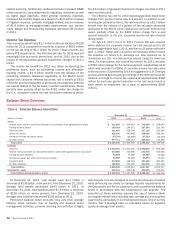
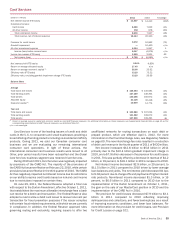
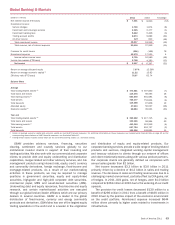
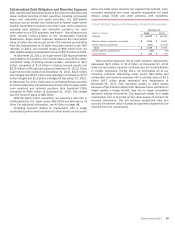
Card Services
(Dollars in millions)
Net interest income (FTE basis)
Noninterest income:
Card income
All other income
Total noninterest income
Total revenue, net of interest expense
Provision for credit losses
Goodwill impairment
All other noninterest expense
Income (loss) before income taxes
Income tax expense (FTE basis)
Net income (loss)
Net interest yield (FTE basis)
Return on average allocated equity
Return on average economic capital (1)
Efficiency ratio (FTE basis)
Efficiency ratio, excluding goodwill impairment charge (FTE basis)
Balance Sheet
Average
Total loans and leases
Total earning assets
Total assets
Allocated equity
Economic capital (1)
Year end
Total loans and leases
Total earning assets
Total assets
2011
$ 11,507
6,286
350
6,636
18,143
3,072
—
6,024
9,047
3,259
$ 5,788
9.04%
27.40
55.08
33.20
33.20
$ 126,084
127,259
130,266
21,128
10,539
$ 120,669
121,992
127,636
2010
$ 14,413
7,049
878
7,927
22,340
10,962
10,400
5,957
(4,979)
2,001
$ (6,980)
9.85%
n/m
23.62
73.22
26.66
$ 145,081
146,304
150,672
32,418
14,774
$ 137,024
138,072
138,491
% Change
(20)%
(11)
(60)
(16)
(19)
(72)
n/m
1
n/m
63
n/m
(13)
(13)
(14)
(35)
(29)
(12)
(12)
(8)
(1) Return on average economic capital and economic capital are non-GAAP financial measures. For additional information on these measures, see Supplemental Financial Data on page 32 and for
corresponding reconciliations to GAAP financial measures, see Statistical Table XVI.
n/m = not meaningful
Card Services is one of the leading issuers of credit and debit
cards in the U.S. to consumers and small businesses providing a
broad offering of lending products including co-branded and affinity
products. During 2011, we sold our Canadian consumer card
business and we are evaluating our remaining international
consumer card operations. In light of these actions, the
international consumer card business results were moved to All
Other, prior period results have been reclassified and the Global
Card Services business segment was renamed Card Services.
During 2010 and 2011, Card Services was negatively impacted
by provisions of the CARD Act. The majority of the provisions of
the CARD Act became effective on February 22, 2010, while certain
provisions became effective in the third quarter of 2010. The CARD
Act has negatively impacted net interest income due to restrictions
on our ability to reprice credit cards based on risk and card income
due to restrictions imposed on certain fees.
On June 29, 2011, the Federal Reserve adopted a final rule
with respect to the Durbin Amendment, effective October 1, 2011,
that established the maximum allowable interchange fees a bank
can receive for a debit card transaction. The Federal Reserve also
adopted a rule to allow a debit card issuer to recover one cent per
transaction for fraud prevention purposes if the issuer complies
with certain fraud-related requirements, with which we are currently
in compliance. In addition, the Federal Reserve approved rules
governing routing and exclusivity, requiring issuers to offer two
unaffiliated networks for routing transactions on each debit or
prepaid product, which are effective April 1, 2012. For more
information on the final interchange rules, see Regulatory Matters
on page 60. The new interchange fee rules resulted in a reduction
of debit card revenue in the fourth quarter of 2011 of $430 million.
Net income increased $12.8 billion to $5.8 billion in 2011
primarily due to the $10.4 billion goodwill impairment charge in
2010, and a $7.9 billion decrease in the provision for credit losses
in 2011. This was partially offset by a decrease in revenue of $4.2
billion, or 19 percent, to $18.1 billion in 2011 compared to 2010.
Net interest income decreased $2.9 billion, or 20 percent, to
$11.5 billion in 2011 compared to 2010 driven by lower average
loan balances and yields. The net interest yield decreased 81 bps
to 9.04 percent due to charge-offs and paydowns of higher interest
rate products. Noninterest income decreased $1.3 billion, or 16
percent, to $6.6 billion in 2011 compared to 2010 due to the
implementation of the Durbin Amendment on October 1, 2011,
the gain on the sale of our MasterCard position in 2010 and the
implementation of the CARD Act in 2010.
The provision for credit losses decreased $7.9 billion to $3.1
billion in 2011 compared to 2010 reflecting improving
delinquencies and collections, and fewer bankruptcies as a result
of improving economic conditions, and lower loan balances. For
more information on the provision for credit losses, see Provision
for Credit Losses on page 102.