Bank of America 2011 Annual Report Download - page 28
Download and view the complete annual report
Please find page 28 of the 2011 Bank of America annual report below. You can navigate through the pages in the report by either clicking on the pages listed below, or by using the keyword search tool below to find specific information within the annual report.-
 1
1 -
2
-
3
-
4
-
5
-
6
-
7
-
8
-
9
-
10
-
11
-
12
-
13
-
14
-
15
-
16
-
17
-
 18
18 -
 19
19 -
 20
20 -
 21
21 -
 22
22 -
 23
23 -
 24
24 -
 25
25 -
 26
26 -
 27
27 -
 28
28 -
 29
29 -
 30
30 -
 31
31 -
 32
32 -
 33
33 -
 34
34 -
 35
35 -
 36
36 -
 37
37 -
 38
38 -
39
-
40
-
41
-
42
-
43
-
44
-
45
-
46
-
47
-
48
-
49
-
50
-
51
-
52
-
53
-
54
-
55
-
56
-
57
-
58
-
59
-
60
-
61
-
62
-
63
-
64
-
65
-
66
-
67
-
68
-
69
-
70
-
71
-
72
-
73
-
74
-
75
-
76
-
77
-
78
-
79
-
80
-
81
-
82
-
83
-
84
-
85
-
86
-
87
-
88
-
89
-
90
-
91
-
92
-
93
-
94
-
95
-
96
-
97
-
98
-
99
-
100
-
101
-
102
-
103
-
104
-
105
-
106
-
107
-
108
-
109
-
110
-
111
-
112
-
113
-
114
-
115
-
116
-
117
-
118
-
119
-
120
-
121
-
122
-
123
-
124
-
125
-
126
-
127
-
128
-
129
-
130
-
131
-
132
-
133
-
134
-
135
-
136
-
137
-
138
-
139
-
140
-
141
-
142
-
143
-
144
-
145
-
146
-
147
-
148
-
149
-
150
-
151
-
152
-
153
-
154
-
155
-
156
-
157
-
158
-
159
-
160
-
161
-
162
-
163
-
164
-
165
-
166
-
167
-
168
-
169
-
170
-
171
-
172
-
173
-
174
-
175
-
176
-
177
-
178
-
179
-
180
-
181
-
182
-
183
-
184
-
185
-
186
-
187
-
188
-
189
-
190
-
191
-
192
-
193
-
194
-
195
-
196
-
197
-
198
-
199
-
200
-
201
-
202
-
203
-
204
-
205
-
206
-
207
-
208
-
209
-
210
-
211
-
212
-
213
-
214
-
215
-
216
-
217
-
218
-
219
-
220
-
221
-
222
-
223
-
224
-
225
-
226
-
227
-
228
-
229
-
230
-
231
-
232
-
233
-
234
-
235
-
236
-
237
-
238
-
239
-
240
-
241
-
242
-
243
-
244
-
245
-
246
-
247
-
248
-
249
-
250
-
251
-
252
-
253
-
254
-
255
-
256
-
257
-
258
-
259
-
260
-
261
-
262
-
263
-
264
-
265
-
266
-
267
-
268
-
269
-
270
-
271
-
272
-
273
-
274
-
275
-
276
 |
 |

26 Bank of America 2011
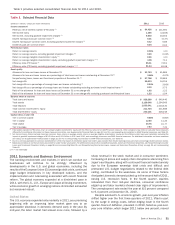
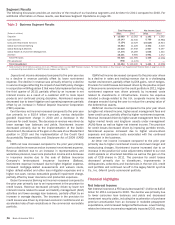
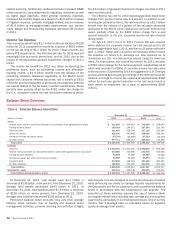
Segment Results
The following discussion provides an overview of the results of our business segments and All Other for 2011 compared to 2010. For
additional information on these results, see Business Segment Operations on page 33.
Table 3
(Dollars in millions)
Deposits
Card Services
Consumer Real Estate Services
Global Commercial Banking
Global Banking & Markets
Global Wealth & Investment Management
All Other
Total FTE basis
FTE adjustment
Total Consolidated
Business Segment Results
Total Revenue (1)
2011
$ 12,689
18,143
(3,154)
10,553
23,618
17,376
15,201
94,426
(972)
$ 93,454
2010
$ 13,562
22,340
10,329
11,226
27,949
16,289
9,695
111,390
(1,170)
$110,220
Net Income (Loss)
2011
$ 1,192
5,788
(19,529)
4,402
2,967
1,635
4,991
1,446
—
$ 1,446
2010
$ 1,362
(6,980)
(8,947)
3,218
6,297
1,340
1,472
(2,238)
—
$ (2,238)
(1) Total revenue is net of interest expense and is on a FTE basis which is a non-GAAP financial measure. For more information on this measure, see Supplemental Financial Data on page 32, and for
a corresponding reconciliation to a GAAP financial measure, see Table XV.
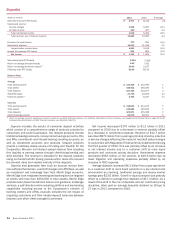
Deposits net income decreased compared to the prior year due
to a decline in revenue partially offset by lower noninterest
expense. The decline in revenue was primarily driven by a decline
in service charges reflecting the impact of overdraft policy changes
in conjunction with Regulation E that were fully implemented during
the third quarter of 2010, partially offset by an increase in net
interest income as a result of a customer shift to more liquid
products and continued pricing discipline. Noninterest expense
decreased due to lower litigation and operating expenses partially
offset by an increase in Federal Deposit Insurance Corporation
(FDIC) expense.
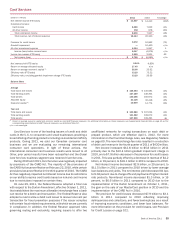
Card Services net income increased compared to the prior year
due primarily to a $10.4 billion non-cash, non-tax deductible
goodwill impairment charge in 2010 and a decrease in the
provision for credit losses. The decrease in revenue was driven by
lower average loan balances and yields. Noninterest income
decreased primarily due to the implementation of the Durbin
Amendment, the absence of the gain on the sale of our MasterCard
position in 2010 and the implementation of the Credit Card
Accountability Responsibility and Disclosure Act of 2009 (CARD
Act).
CRES net loss increased compared to the prior year primarily
due to a decline in revenue and an increase in noninterest expense.
Revenue declined due to an increase in representations and
warranties provision, lower core production income and a decrease
in insurance income due to the sale of Balboa Insurance
Company’s lender-placed insurance business (Balboa).
Noninterest expense increased due to higher litigation expense,
increased mortgage-related assessments and waivers costs,
higher default-related and other loss mitigation expenses and a
higher non-cash, non-tax deductible goodwill impairment charge,
partially offset by lower insurance and production expenses.
Global Commercial Banking net income increased compared to
the prior year primarily due to an improvement in the provision for
credit losses. Revenue decreased primarily driven by lower net
interest income related to asset and liability management (ALM)
activities and lower average loan balances, partially offset by an
increase in average deposits. The decrease in the provision for
credit losses was driven by improved economic conditions and an
accelerated rate of loan resolutions in the commercial real estate
portfolio.
GBAM net income decreased compared to the prior year driven
by a decline in sales and trading revenue due to a challenging
market environment, partially offset by DVA gains, net of hedges.
Provision for credit losses decreased driven by the positive impact
of the economic environment on the credit portfolio in 2011. Higher
noninterest expense was driven primarily by increased costs
related to investments in infrastructure. Income tax expense
included a charge related to the U.K. corporate income tax rate
changes enacted during the year to reduce the carrying value of
the deferred tax assets.
GWIM net income increased compared to the prior year driven
by higher net interest income, higher asset management fees and
lower credit costs, partially offset by higher noninterest expense.
Revenue increased driven by higher asset management fees from
higher market levels and long-term assets under management
(AUM) flows as well as higher net interest income. The provision
for credit losses decreased driven by improving portfolio trends.
Noninterest expense increased due to higher volume-driven
expenses and personnel costs associated with the continued
investment in the business.
All Other net income increased compared to the prior year
primarily due to higher noninterest income and lower merger and
restructuring charges. Noninterest income increased due to an
increase in the positive fair value adjustments related to our own
credit spreads on structured liabilities as well as the gain on the
sale of CCB shares in 2011. The provision for credit losses
decreased primarily due to divestitures, improvements in
delinquencies, collections and insolvencies in the non-U.S. credit
card portfolio and continued run-off in the legacy Merrill Lynch &
Co., Inc. (Merrill Lynch) commercial portfolio.
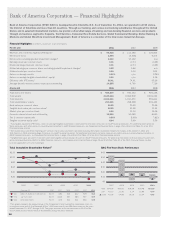
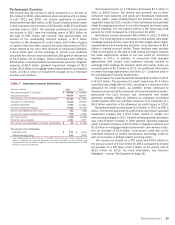
Financial Highlights
Net Interest Income
Net interest income on a FTE basis decreased $7.1 billion to $45.6
billion for 2011 compared to 2010. The decline was primarily due
to lower consumer loan balances and yields and decreased
investment security yields, including the acceleration of purchase
premium amortization from an increase in modeled prepayment
expectations, and increased hedge ineffectiveness. Lower trading-
related net interest income also negatively impacted 2011 results.