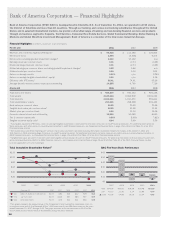
Bank of America 2011 Annual Report Download - page 24
Download and view the complete annual report
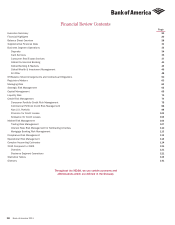
Please find page 24 of the 2011 Bank of America annual report below. You can navigate through the pages in the report by either clicking on the pages listed below, or by using the keyword search tool below to find specific information within the annual report.-
 1
1 -
2
-
3
-
4
-
5
-
6
-
7
-
8
-
9
-
10
-
11
-
12
-
13
-
 14
14 -
 15
15 -
 16
16 -
 17
17 -
 18
18 -
 19
19 -
 20
20 -
 21
21 -
 22
22 -
 23
23 -
 24
24 -
 25
25 -
 26
26 -
 27
27 -
 28
28 -
 29
29 -
 30
30 -
 31
31 -
 32
32 -
 33
33 -
 34
34 -
35
-
36
-
37
-
38
-
39
-
40
-
41
-
42
-
43
-
44
-
45
-
46
-
47
-
48
-
49
-
50
-
51
-
52
-
53
-
54
-
55
-
56
-
57
-
58
-
59
-
60
-
61
-
62
-
63
-
64
-
65
-
66
-
67
-
68
-
69
-
70
-
71
-
72
-
73
-
74
-
75
-
76
-
77
-
78
-
79
-
80
-
81
-
82
-
83
-
84
-
85
-
86
-
87
-
88
-
89
-
90
-
91
-
92
-
93
-
94
-
95
-
96
-
97
-
98
-
99
-
100
-
101
-
102
-
103
-
104
-
105
-
106
-
107
-
108
-
109
-
110
-
111
-
112
-
113
-
114
-
115
-
116
-
117
-
118
-
119
-
120
-
121
-
122
-
123
-
124
-
125
-
126
-
127
-
128
-
129
-
130
-
131
-
132
-
133
-
134
-
135
-
136
-
137
-
138
-
139
-
140
-
141
-
142
-
143
-
144
-
145
-
146
-
147
-
148
-
149
-
150
-
151
-
152
-
153
-
154
-
155
-
156
-
157
-
158
-
159
-
160
-
161
-
162
-
163
-
164
-
165
-
166
-
167
-
168
-
169
-
170
-
171
-
172
-
173
-
174
-
175
-
176
-
177
-
178
-
179
-
180
-
181
-
182
-
183
-
184
-
185
-
186
-
187
-
188
-
189
-
190
-
191
-
192
-
193
-
194
-
195
-
196
-
197
-
198
-
199
-
200
-
201
-
202
-
203
-
204
-
205
-
206
-
207
-
208
-
209
-
210
-
211
-
212
-
213
-
214
-
215
-
216
-
217
-
218
-
219
-
220
-
221
-
222
-
223
-
224
-
225
-
226
-
227
-
228
-
229
-
230
-
231
-
232
-
233
-
234
-
235
-
236
-
237
-
238
-
239
-
240
-
241
-
242
-
243
-
244
-
245
-
246
-
247
-
248
-
249
-
250
-
251
-
252
-
253
-
254
-
255
-
256
-
257
-
258
-
259
-
260
-
261
-
262
-
263
-
264
-
265
-
266
-
267
-
268
-
269
-
270
-
271
-
272
-
273
-
274
-
275
-
276
 |
 |
22 Bank of America 2011
to above two percent by year end. Nevertheless, bond yields, which
drifted gradually lower in the first half of 2011, fell during a volatile
third quarter amid anxiety over the European sovereign debt crisis,
exacerbated by the U.S. debt ceiling debate and fears of recession.
Despite the Standard & Poor’s Rating Services (S&P) ratings
downgrade of U.S. sovereign debt, mounting concerns about
Europe’s financial crisis generated strong demand for U.S.
government securities. The Federal Reserve completed its second
round of quantitative easing near mid-year. Responding to sharp
declines in equity markets, low consumer expectations and
heightened worries about recession, the Federal Reserve adopted
another financial support program in September 2011 aimed at
lowering bond yields. The program involved sales of $400 billion
of shorter-term (less than three years) government securities and
purchases of an equal volume of longer-term (six years and over)
government bonds. Bonds yields held near all-time post-Great
Depression lows at year end.
Housing activity remained at historically low levels in 2011 and
the supply of unsold homes remained high. Meanwhile, corporate
profits continued to grow at a robust pace in 2011, despite slowing
from their initial sharp rebound. After bottoming in late 2010,
commercial and industrial lending also accelerated in 2011.
Europe
Europe’s financial crisis escalated in 2011 despite a series of
initiatives by policymakers, and several European nations were
experiencing recessionary conditions in the fourth quarter.
Europe’s problems involve unsustainably high public debt in some
nations, including Greece and Portugal, slow growth and significant
refinancing risk related to maturing sovereign debt in Italy, and
excess household debt and sharp declines in wealth stemming
from falling home values following unsustainable housing bubbles
in other nations, including Spain and Ireland. These national
challenges are closely intertwined with the problems facing
Europe’s banks, which are some of the largest holders of the bonds
of troubled European nations. During 2011, financial markets
became increasingly skeptical that government policies would
resolve these problems, and risk-averse investors reduced their
exposures to bonds of troubled nations, driving up their bond yields
and, to varying degrees, restricting access to capital markets. This
exacerbated already onerous debt service burdens. In response,
European policymakers provided financial support to troubled
nations through the European Financial Stability Facility (EFSF) and
purchases of sovereign debt by the European Central Bank (ECB).
Despite these efforts, sharp increases in the bond yields of
Spanish and Italian bonds further complicated Europe’s financial
problems beyond the current capabilities of the EFSF. As the
magnitude of the financial stresses rose, reflected in higher
sovereign bond yields and mounting funding shortfalls at select
banks, the ECB instituted new programs to provide low-cost, three-
year loans to European banks, and expanded collateral eligibility.
This served to alleviate bank funding pressures toward year end
and provided greater liquidity in sovereign debt markets.
Asia
Japan’s economic environment in 2011 was marked by the trauma
of its massive earthquake in early 2011 that caused a dramatic
decline in economic activity followed by a quick rebound. A sharp
decline in consumption and domestic demand was accompanied
by temporary production shutdowns of various intermediate and
durable goods that disrupted supply chains throughout Asia and
the world. The ripple effects were pronounced, although temporary,
throughout Asia. China continued to grow rapidly throughout 2011,
with real GDP growth exceeding nine percent, despite elevated
inflation and government efforts to constrain price pressures
through the tightening of monetary policy and bank credit, and
regulations that limit speculation and price increases in real
estate. China’s economic growth slowed modestly in the second
half of the year, reflecting in part slower growth of exports to Europe
and other destinations. China’s inflation also began to subside
toward year end. Other Asian nations continued to experience
strong growth rates.
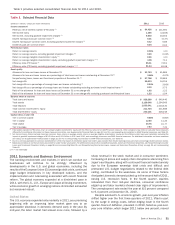
For information on our non-U.S. portfolio, see Non-U.S. Portfolio
on page 98 and Note 28 – Performance by Geographical Area to
the Consolidated Financial Statements.
Recent Events
Mortgage Related Matters
Department of Justice/Attorney General Matters
On February 9, 2012, we reached agreements in principle
(collectively, the Servicing Resolution Agreements) with (1) the U.S.
Department of Justice (DOJ), various federal regulatory agencies
and 49 state attorneys general to resolve federal and state
investigations into certain origination, servicing and foreclosure
practices (the Global AIP), (2) the Federal Housing Administration
(FHA) to resolve certain claims relating to the origination of FHA-
insured mortgage loans, primarily by Countrywide prior to and for
a period following our acquisition of that lender (the FHA AIP) and
(3) each of the Federal Reserve and the Office of the Comptroller
of the Currency (OCC) regarding civil monetary penalties related
to conduct that was the subject of consent orders entered into
with the banking regulators in April 2011 (the Consent Order AIPs).
The Servicing Resolution Agreements are subject to ongoing
discussions among the parties and completion and execution of
definitive documentation, as well as required regulatory and court
approvals. The FHA AIP provides for an upfront cash payment and
an additional cash payment if we fail to meet certain principal
reduction thresholds over a three-year period. Under the terms of
the Servicing Resolution Agreements, the federal and participating
state governments would provide us with releases from liability for
certain alleged residential mortgage origination, servicing and
foreclosure deficiencies.
The financial impact of the Servicing Resolution Agreements
is not expected to require any additional reserves over existing
accruals as of December 31, 2011, based on our understanding
of the terms of the Servicing Resolution Agreements. The
refinancing assistance commitment under the Servicing
Resolution Agreements is expected to be recognized as lower
interest income in future periods as qualified borrowers pay
reduced interest rates on loans refinanced. The Servicing
Resolution Agreements do not cover claims arising out of
securitization, including representations made to investors
respecting mortgage-backed securities (MBS) and certain other
claims. For additional information, see Item 1A. Risk Factors of
this Annual Report on Form 10-K and Off-Balance Sheet
Arrangements and Contractual Obligations – Other Mortgage-
related Matters on page 57.