Bank of America 2011 Annual Report Download - page 125
Download and view the complete annual report
Please find page 125 of the 2011 Bank of America annual report below. You can navigate through the pages in the report by either clicking on the pages listed below, or by using the keyword search tool below to find specific information within the annual report.-
 1
1 -
2
-
3
-
4
-
5
-
6
-
7
-
8
-
9
-
10
-
11
-
12
-
13
-
14
-
15
-
16
-
17
-
18
-
19
-
20
-
21
-
22
-
23
-
24
-
25
-
26
-
27
-
28
-
29
-
30
-
31
-
32
-
33
-
34
-
35
-
36
-
37
-
38
-
39
-
40
-
41
-
42
-
43
-
44
-
45
-
46
-
47
-
48
-
49
-
50
-
51
-
52
-
53
-
54
-
55
-
56
-
57
-
58
-
59
-
60
-
61
-
62
-
63
-
64
-
65
-
66
-
67
-
68
-
69
-
70
-
71
-
72
-
73
-
74
-
75
-
76
-
77
-
78
-
79
-
80
-
81
-
82
-
83
-
84
-
85
-
86
-
87
-
88
-
89
-
90
-
91
-
92
-
93
-
94
-
95
-
96
-
97
-
98
-
99
-
100
-
101
-
102
-
103
-
104
-
105
-
106
-
107
-
108
-
109
-
110
-
111
-
112
-
113
-
114
-
 115
115 -
 116
116 -
 117
117 -
 118
118 -
 119
119 -
 120
120 -
 121
121 -
 122
122 -
 123
123 -
 124
124 -
 125
125 -
 126
126 -
 127
127 -
 128
128 -
 129
129 -
 130
130 -
 131
131 -
 132
132 -
 133
133 -
 134
134 -
 135
135 -
136
-
137
-
138
-
139
-
140
-
141
-
142
-
143
-
144
-
145
-
146
-
147
-
148
-
149
-
150
-
151
-
152
-
153
-
154
-
155
-
156
-
157
-
158
-
159
-
160
-
161
-
162
-
163
-
164
-
165
-
166
-
167
-
168
-
169
-
170
-
171
-
172
-
173
-
174
-
175
-
176
-
177
-
178
-
179
-
180
-
181
-
182
-
183
-
184
-
185
-
186
-
187
-
188
-
189
-
190
-
191
-
192
-
193
-
194
-
195
-
196
-
197
-
198
-
199
-
200
-
201
-
202
-
203
-
204
-
205
-
206
-
207
-
208
-
209
-
210
-
211
-
212
-
213
-
214
-
215
-
216
-
217
-
218
-
219
-
220
-
221
-
222
-
223
-
224
-
225
-
226
-
227
-
228
-
229
-
230
-
231
-
232
-
233
-
234
-
235
-
236
-
237
-
238
-
239
-
240
-
241
-
242
-
243
-
244
-
245
-
246
-
247
-
248
-
249
-
250
-
251
-
252
-
253
-
254
-
255
-
256
-
257
-
258
-
259
-
260
-
261
-
262
-
263
-
264
-
265
-
266
-
267
-
268
-
269
-
270
-
271
-
272
-
273
-
274
-
275
-
276
 |
 |

Bank of America 2011 123
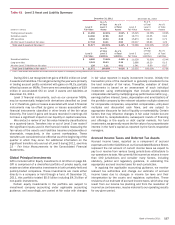
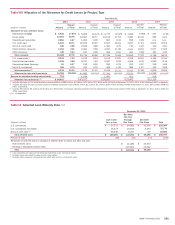
Statistical Tables
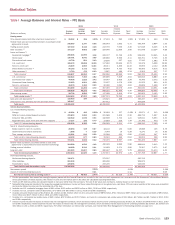
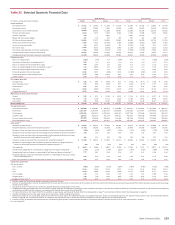
Table I Average Balances and Interest Rates – FTE Basis
(Dollars in millions)
Earning assets
Time deposits placed and other short-term investments (1)
Federal funds sold and securities borrowed or purchased under
agreements to resell
Trading account assets
Debt securities (2)
Loans and leases (3):
Residential mortgage (4)
Home equity
Discontinued real estate
U.S. credit card
Non-U.S. credit card
Direct/Indirect consumer (5)
Other consumer (6)
Total consumer
U.S. commercial
Commercial real estate (7)
Commercial lease financing
Non-U.S. commercial
Total commercial
Total loans and leases
Other earning assets
Total earning assets (8)
Cash and cash equivalents (1)
Other assets, less allowance for loan and lease losses
Total assets
Interest-bearing liabilities
U.S. interest-bearing deposits:
Savings
NOW and money market deposit accounts
Consumer CDs and IRAs
Negotiable CDs, public funds and other time deposits
Total U.S. interest-bearing deposits
Non-U.S. interest-bearing deposits:
Banks located in non-U.S. countries
Governments and official institutions
Time, savings and other
Total non-U.S. interest-bearing deposits
Total interest-bearing deposits
Federal funds purchased, securities loaned or sold under
agreements to repurchase and other short-term borrowings
Trading account liabilities
Long-term debt
Total interest-bearing liabilities (8)
Noninterest-bearing sources:
Noninterest-bearing deposits
Other liabilities
Shareholders’ equity
Total liabilities and shareholders’ equity
Net interest spread
Impact of noninterest-bearing sources
Net interest income/yield on earning assets (1)
2011
Average
Balance
$ 28,242
245,069
187,340
337,120
265,546
130,781
14,730
105,478
24,049
90,163
2,760
633,507
192,524
44,406
21,383
46,276
304,589
938,096
98,792
1,834,659
112,616
349,047
$ 2,296,322
$ 40,364
470,519
110,922
17,227
639,032
20,563
1,985
61,851
84,399
723,431
324,269
84,689
421,229
1,553,618
312,371
201,238
229,095
$ 2,296,322
Interest
Income/
Expense
$ 366
2,147
6,142
9,602
11,096
5,041
501
10,808
2,656
3,716
176
33,994
7,360
1,522
1,001
1,382
11,265
45,259
3,506
67,022
186
$ 100
1,060
1,045
120
2,325
138
7
532
677
3,002
4,599
2,212
11,807
21,620
$ 45,402
Yield/
Rate
1.29%
0.88
3.28
2.85
4.18
3.85
3.40
10.25
11.04
4.12
6.39
5.37
3.82
3.43
4.68
2.99
3.70
4.82
3.55
3.65
0.25%
0.23
0.94
0.70
0.36
0.67
0.35
0.86
0.80
0.42
1.42
2.61
2.80
1.39
2.26%
0.21
2.47%
2010
Average
Balance
$ 27,419
256,943
213,745
323,946
245,727
145,860
13,830
117,962
28,011
96,649
2,927
650,966
195,895
59,947
21,427
30,096
307,365
958,331
117,189
1,897,573
174,621
367,412
$2,439,606
$ 36,649
441,589
142,648
17,683
638,569
18,102
3,349
55,059
76,510
715,079
430,329
91,669
490,497
1,727,574
273,507
205,290
233,235
$2,439,606
Interest
Income/
Expense
$ 292
1,832
7,050
11,850
11,736
5,990
527
12,644
3,450
4,753
186
39,286
7,909
2,000
1,070
1,091
12,070
51,356
3,919
76,299
368
$ 157
1,405
1,723
226
3,511
144
10
332
486
3,997
3,699
2,571
13,707
23,974
$ 52,325
Yield/
Rate
1.06%
0.71
3.30
3.66
4.78
4.11
3.81
10.72
12.32
4.92
6.34
6.04
4.04
3.34
4.99
3.62
3.93
5.36
3.34
4.02
0.43%
0.32
1.21
1.28
0.55
0.80
0.28
0.60
0.64
0.56
0.86
2.80
2.79
1.39
2.63%
0.13
2.76%
2009
Average
Balance
$27,465
235,764
217,048
271,048
249,335
154,761
17,340
52,378
19,655
99,993
3,303
596,765
223,813
73,349
21,979
32,899
352,040
948,805
130,063
1,830,193
196,237
416,638
$2,443,068
$33,671
358,712
218,041
37,796
648,220
18,688
6,270
57,045
82,003
730,223
488,644
72,207
446,634
1,737,708
250,743
209,972
244,645
$2,443,068
Interest
Income/
Expense
$334
2,894
8,236
13,224
13,535
6,736
1,082
5,666
2,122
6,016
237
35,394
8,883
2,372
990
1,406
13,651
49,045
5,105
78,838
379
$215
1,557
5,054
473
7,299
145
16
347
508
7,807
5,512
2,075
15,413
30,807
$48,031
Yield/
Rate
1.22%
1.23
3.79
4.88
5.43
4.35
6.24
10.82
10.80
6.02
7.17
5.93
3.97
3.23
4.51
4.27
3.88
5.17
3.92
4.31
0.64%
0.43
2.32
1.25
1.13
0.78
0.26
0.61
0.62
1.07
1.13
2.87
3.45
1.77
2.54%
0.08
2.62%
(1) For this presentation, fees earned on overnight deposits placed with the Federal Reserve are included in the cash and cash equivalents line, consistent with the Corporation’s Consolidated Balance
Sheet presentation of these deposits. Net interest income and net interest yield in the table are calculated excluding these fees.
(2) Yields on AFS debt securities are calculated based on fair value rather than the cost basis. The use of fair value does not have a material impact on net interest yield.
(3) Nonperforming loans are included in the respective average loan balances. Income on these nonperforming loans is recognized on a cash basis. PCI loans were recorded at fair value upon acquisition
and accrete interest income over the remaining life of the loan.
(4) Includes non-U.S. residential mortgage loans of $91 million, $410 million and $622 million in 2011, 2010 and 2009, respectively.
(5) Includes non-U.S. consumer loans of $8.5 billion, $7.9 billion and $8.0 billion in 2011, 2010 and 2009, respectively.
(6) Includes consumer finance loans of $1.8 billion, $2.1 billion and $2.4 billion; other non-U.S. consumer loans of $878 million, $731 million and $657 million; and consumer overdrafts of $93 million,
$111 million and $217 million in 2011, 2010 and 2009, respectively.
(7) Includes U.S. commercial real estate loans of $42.1 billion, $57.3 billion and $70.7 billion; and non-U.S. commercial real estate loans of $2.3 billion, $2.7 billion and $2.7 billion in 2011, 2010
and 2009, respectively.
(8) Interest income includes the impact of interest rate risk management contracts, which decreased interest income on the underlying assets $2.6 billion, $1.4 billion and $456 million in 2011, 2010
and 2009, respectively. Interest expense includes the impact of interest rate risk management contracts, which decreased interest expense on the underlying liabilities $2.6 billion, $3.5 billion and
$3.0 billion in 2011, 2010 and 2009, respectively. For further information on interest rate contracts, see Interest Rate Risk Management for Nontrading Activities on page 110.