Bank of America 2011 Annual Report Download - page 243
Download and view the complete annual report
Please find page 243 of the 2011 Bank of America annual report below. You can navigate through the pages in the report by either clicking on the pages listed below, or by using the keyword search tool below to find specific information within the annual report.-
 1
1 -
2
-
3
-
4
-
5
-
6
-
7
-
8
-
9
-
10
-
11
-
12
-
13
-
14
-
15
-
16
-
17
-
18
-
19
-
20
-
21
-
22
-
23
-
24
-
25
-
26
-
27
-
28
-
29
-
30
-
31
-
32
-
33
-
34
-
35
-
36
-
37
-
38
-
39
-
40
-
41
-
42
-
43
-
44
-
45
-
46
-
47
-
48
-
49
-
50
-
51
-
52
-
53
-
54
-
55
-
56
-
57
-
58
-
59
-
60
-
61
-
62
-
63
-
64
-
65
-
66
-
67
-
68
-
69
-
70
-
71
-
72
-
73
-
74
-
75
-
76
-
77
-
78
-
79
-
80
-
81
-
82
-
83
-
84
-
85
-
86
-
87
-
88
-
89
-
90
-
91
-
92
-
93
-
94
-
95
-
96
-
97
-
98
-
99
-
100
-
101
-
102
-
103
-
104
-
105
-
106
-
107
-
108
-
109
-
110
-
111
-
112
-
113
-
114
-
115
-
116
-
117
-
118
-
119
-
120
-
121
-
122
-
123
-
124
-
125
-
126
-
127
-
128
-
129
-
130
-
131
-
132
-
133
-
134
-
135
-
136
-
137
-
138
-
139
-
140
-
141
-
142
-
143
-
144
-
145
-
146
-
147
-
148
-
149
-
150
-
151
-
152
-
153
-
154
-
155
-
156
-
157
-
158
-
159
-
160
-
161
-
162
-
163
-
164
-
165
-
166
-
167
-
168
-
169
-
170
-
171
-
172
-
173
-
174
-
175
-
176
-
177
-
178
-
179
-
180
-
181
-
182
-
183
-
184
-
185
-
186
-
187
-
188
-
189
-
190
-
191
-
192
-
193
-
194
-
195
-
196
-
197
-
198
-
199
-
200
-
201
-
202
-
203
-
204
-
205
-
206
-
207
-
208
-
209
-
210
-
211
-
212
-
213
-
214
-
215
-
216
-
217
-
218
-
219
-
220
-
221
-
222
-
223
-
224
-
225
-
226
-
227
-
228
-
229
-
230
-
231
-
232
-
 233
233 -
 234
234 -
 235
235 -
 236
236 -
 237
237 -
 238
238 -
 239
239 -
 240
240 -
 241
241 -
 242
242 -
 243
243 -
 244
244 -
 245
245 -
 246
246 -
 247
247 -
 248
248 -
 249
249 -
 250
250 -
 251
251 -
 252
252 -
 253
253 -
254
-
255
-
256
-
257
-
258
-
259
-
260
-
261
-
262
-
263
-
264
-
265
-
266
-
267
-
268
-
269
-
270
-
271
-
272
-
273
-
274
-
275
-
276
 |
 |

Bank of America 2011 241
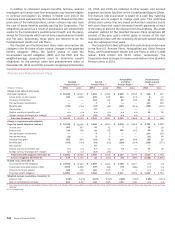
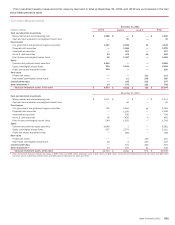
Plan investment assets measured at fair value by level and in total at December 31, 2011 and 2010 are summarized in the Fair
Value Measurements table.
Fair Value Measurements
(Dollars in millions)
Cash and short-term investments
Money market and interest-bearing cash
Cash and cash equivalent commingled/mutual funds
Fixed income
U.S. government and government agency securities
Corporate debt securities
Asset-backed securities
Non-U.S. debt securities
Fixed income commingled/mutual funds
Equity
Common and preferred equity securities
Equity commingled/mutual funds
Public real estate investment trusts
Real estate
Private real estate
Real estate commingled/mutual funds
Limited partnerships
Other investments (1)
Total plan investment assets, at fair value
December 31, 2011
Level 1
$ 1,065
—
1,197
—
—
53
82
6,862
390
200
—
—
—
14
$ 9,863
December 31, 2010
$ 1,471
—
701
—
—
36
240
6,980
637
—
—
30
—
19
$ 10,114
Level 2
$—
30
2,899
1,058
907
479
1,487
—
2,094
—
—
11
105
572
$ 9,642
$—
45
2,604
1,106
796
420
1,503
1
2,374
168
—
2
101
230
$ 9,350
Level 3
$—
—
13
—
—
10
—
—
—
—
113
249
232
122
$739
$—
—
14
—
—
9
—
—
—
—
110
215
230
94
$672
Total
$ 1,065
30
4,109
1,058
907
542
1,569
6,862
2,484
200
113
260
337
708
$ 20,244
$ 1,471
45
3,319
1,106
796
465
1,743
6,981
3,011
168
110
247
331
343
$ 20,136
(1) Other investments represent interest rate swaps of $467 million and $198 million, participant loans of $75 million and $79 million, commodity and balanced funds of $116 million and $38 million
and other various investments of $50 million and $28 million at December 31, 2011 and 2010.