Bank of America 2011 Annual Report Download - page 81
Download and view the complete annual report
Please find page 81 of the 2011 Bank of America annual report below. You can navigate through the pages in the report by either clicking on the pages listed below, or by using the keyword search tool below to find specific information within the annual report.-
 1
1 -
2
-
3
-
4
-
5
-
6
-
7
-
8
-
9
-
10
-
11
-
12
-
13
-
14
-
15
-
16
-
17
-
18
-
19
-
20
-
21
-
22
-
23
-
24
-
25
-
26
-
27
-
28
-
29
-
30
-
31
-
32
-
33
-
34
-
35
-
36
-
37
-
38
-
39
-
40
-
41
-
42
-
43
-
44
-
45
-
46
-
47
-
48
-
49
-
50
-
51
-
52
-
53
-
54
-
55
-
56
-
57
-
58
-
59
-
60
-
61
-
62
-
63
-
64
-
65
-
66
-
67
-
68
-
69
-
70
-
 71
71 -
 72
72 -
 73
73 -
 74
74 -
 75
75 -
 76
76 -
 77
77 -
 78
78 -
 79
79 -
 80
80 -
 81
81 -
 82
82 -
 83
83 -
 84
84 -
 85
85 -
 86
86 -
 87
87 -
 88
88 -
 89
89 -
 90
90 -
 91
91 -
92
-
93
-
94
-
95
-
96
-
97
-
98
-
99
-
100
-
101
-
102
-
103
-
104
-
105
-
106
-
107
-
108
-
109
-
110
-
111
-
112
-
113
-
114
-
115
-
116
-
117
-
118
-
119
-
120
-
121
-
122
-
123
-
124
-
125
-
126
-
127
-
128
-
129
-
130
-
131
-
132
-
133
-
134
-
135
-
136
-
137
-
138
-
139
-
140
-
141
-
142
-
143
-
144
-
145
-
146
-
147
-
148
-
149
-
150
-
151
-
152
-
153
-
154
-
155
-
156
-
157
-
158
-
159
-
160
-
161
-
162
-
163
-
164
-
165
-
166
-
167
-
168
-
169
-
170
-
171
-
172
-
173
-
174
-
175
-
176
-
177
-
178
-
179
-
180
-
181
-
182
-
183
-
184
-
185
-
186
-
187
-
188
-
189
-
190
-
191
-
192
-
193
-
194
-
195
-
196
-
197
-
198
-
199
-
200
-
201
-
202
-
203
-
204
-
205
-
206
-
207
-
208
-
209
-
210
-
211
-
212
-
213
-
214
-
215
-
216
-
217
-
218
-
219
-
220
-
221
-
222
-
223
-
224
-
225
-
226
-
227
-
228
-
229
-
230
-
231
-
232
-
233
-
234
-
235
-
236
-
237
-
238
-
239
-
240
-
241
-
242
-
243
-
244
-
245
-
246
-
247
-
248
-
249
-
250
-
251
-
252
-
253
-
254
-
255
-
256
-
257
-
258
-
259
-
260
-
261
-
262
-
263
-
264
-
265
-
266
-
267
-
268
-
269
-
270
-
271
-
272
-
273
-
274
-
275
-
276
 |
 |

Bank of America 2011 79
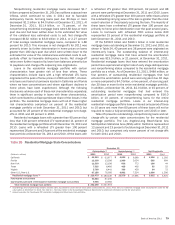
Nonperforming residential mortgage loans decreased $1.7
billion compared to December 31, 2010 as outflows outpaced new
inflows, which continued to slow in 2011 due to favorable
delinquency trends. Accruing loans past due 30 days or more
decreased $1.2 billion to $4.0 billion at December 31, 2011. At
December 31, 2011, $11.4 billion, or 71 percent, of the
nonperforming residential mortgage loans were 180 days or more
past due and had been written down to the estimated fair value
of the collateral less estimated costs to sell. Net charge-offs
increased $162 million to $3.8 billion in 2011, or 2.27 percent
of total average residential mortgage loans, compared to 1.86
percent for 2010. This increase in net charge-offs for 2011 was
primarily driven by further deterioration in home prices on loans
greater than 180 days past due which were written down to the
estimated fair value of the collateral less estimated costs to sell,
partially offset by favorable delinquency trends. Net charge-off
ratios were further impacted by lower loan balances primarily due
to paydowns and charge-offs outpacing new originations.
Loans in the residential mortgage portfolio with certain
characteristics have greater risk of loss than others. These
characteristics include loans with a high refreshed LTV, loans
originated at the peak of home prices in 2006 and 2007, interest-
only loans and loans to borrowers located in California and Florida
where we have concentrations and where significant declines in
home prices have been experienced. Although the following
disclosures address each of these risk characteristics separately,
there is significant overlap in loans with these characteristics,
which contributed to a disproportionate share of the losses in the
portfolio. The residential mortgage loans with all of these higher
risk characteristics comprised six percent of the residential
mortgage portfolio at both December 31, 2011 and 2010, but
accounted for 23 percent of the residential mortgage net charge-
offs in 2011 and 26 percent in 2010.
Residential mortgage loans with a greater than 90 percent but
less than 100 percent refreshed LTV represented 11 percent of
the residential mortgage portfolio at both December 31, 2011 and
2010. Loans with a refreshed LTV greater than 100 percent
represented 26 percent and 24 percent of the residential mortgage
loan portfolio at December 31, 2011 and 2010. Of the loans with
a refreshed LTV greater than 100 percent, 92 percent and 88
percent were performing at December 31, 2011 and 2010. Loans
with a refreshed LTV greater than 100 percent reflect loans where
the outstanding carrying value of the loan is greater than the most
recent valuation of the property securing the loan. The majority of
these loans have a refreshed LTV greater than 100 percent due
primarily to home price deterioration over the past several years.
Loans to borrowers with refreshed FICO scores below 620
represented 15 percent of the residential mortgage portfolio at
both December 31, 2011 and 2010.
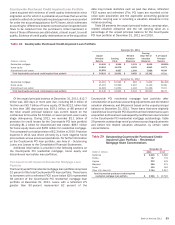
Of the $158.5 billion and $180.1 billion in total residential
mortgage loans outstanding at December 31, 2011 and 2010, as
shown in Table 24, 40 percent and 38 percent were originated as
interest-only loans. The outstanding balance of interest-only
residential mortgage loans that have entered the amortization
period was $13.3 billion, or 21 percent, at December 31, 2011.
Residential mortgage loans that have entered the amortization
period have experienced a higher rate of early stage delinquencies
and nonperforming status compared to the residential mortgage
portfolio as a whole. As of December 31, 2011, $484 million, or
four percent, of outstanding residential mortgages that had
entered the amortization period were accruing past due 30 days
or more compared to $4.0 billion, or two percent, of accruing past
due 30 days or more for the entire residential mortgage portfolio.
In addition, at December 31, 2011, $2.0 billion, or 15 percent, of
outstanding residential mortgages that had entered the
amortization period were nonperforming compared to $16.0
billion, or 10 percent, of nonperforming loans for the entire
residential mortgage portfolio. Loans in our interest-only
residential mortgage portfolio have an interest-only period of three
to 10 years and more than 80 percent of these loans will not be
required to make a fully-amortizing payment until 2015 or later.
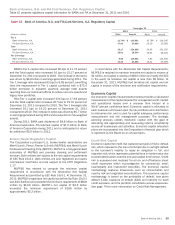
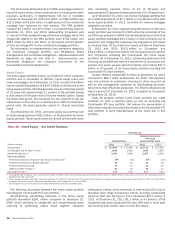
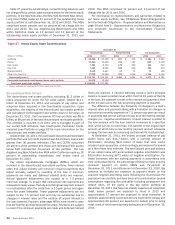
Table 25 presents outstandings, nonperforming loans and net
charge-offs by certain state concentrations for the residential
mortgage portfolio. The Los Angeles-Long Beach-Santa Ana
Metropolitan Statistical Area (MSA) within California represented
12 percent and 13 percent of outstandings at December 31, 2011
and 2010, but comprised only seven percent of net charge-offs
for both 2011 and 2010.
Table 25
(Dollars in millions)
California
Florida
New York
Texas
Virginia
Other U.S./Non-U.S.
Residential mortgage loans (2)
Fully-insured loan portfolio
Countrywide purchased credit-impaired residential mortgage loan portfolio
Total residential mortgage loan portfolio
Residential Mortgage State Concentrations
December 31
Outstandings (1)
2011
$ 54,203
12,338
11,539
7,525
5,709
67,156
$ 158,470
93,854
9,966
$ 262,290
2010
$ 63,677
13,298
12,198
8,466
6,441
76,056
$180,136
67,245
10,592
$257,973
Nonperforming (1)
2011
$ 5,606
1,900
838
425
399
6,802
$ 15,970
2010
$ 6,389
2,054
772
492
450
7,534
$ 17,691
Net Charge-offs
2011
$ 1,326
595
106
55
64
1,686
$ 3,832
2010
$ 1,392
604
44
52
72
1,506
$ 3,670
(1) Outstandings and nonperforming amounts exclude loans accounted for under the fair value option at December 31, 2011. There were no residential mortgage loans accounted for under the fair
value option at December 31, 2010. See Note 23 – Fair Value Option to the Consolidated Financial Statements for additional information on the fair value option.
(2) Amount excludes the Countrywide PCI residential mortgage and fully-insured loan portfolios.