Bank of America 2011 Annual Report Download - page 97
Download and view the complete annual report
Please find page 97 of the 2011 Bank of America annual report below. You can navigate through the pages in the report by either clicking on the pages listed below, or by using the keyword search tool below to find specific information within the annual report.-
 1
1 -
2
-
3
-
4
-
5
-
6
-
7
-
8
-
9
-
10
-
11
-
12
-
13
-
14
-
15
-
16
-
17
-
18
-
19
-
20
-
21
-
22
-
23
-
24
-
25
-
26
-
27
-
28
-
29
-
30
-
31
-
32
-
33
-
34
-
35
-
36
-
37
-
38
-
39
-
40
-
41
-
42
-
43
-
44
-
45
-
46
-
47
-
48
-
49
-
50
-
51
-
52
-
53
-
54
-
55
-
56
-
57
-
58
-
59
-
60
-
61
-
62
-
63
-
64
-
65
-
66
-
67
-
68
-
69
-
70
-
71
-
72
-
73
-
74
-
75
-
76
-
77
-
78
-
79
-
80
-
81
-
82
-
83
-
84
-
85
-
86
-
 87
87 -
 88
88 -
 89
89 -
 90
90 -
 91
91 -
 92
92 -
 93
93 -
 94
94 -
 95
95 -
 96
96 -
 97
97 -
 98
98 -
 99
99 -
 100
100 -
 101
101 -
 102
102 -
 103
103 -
 104
104 -
 105
105 -
 106
106 -
 107
107 -
108
-
109
-
110
-
111
-
112
-
113
-
114
-
115
-
116
-
117
-
118
-
119
-
120
-
121
-
122
-
123
-
124
-
125
-
126
-
127
-
128
-
129
-
130
-
131
-
132
-
133
-
134
-
135
-
136
-
137
-
138
-
139
-
140
-
141
-
142
-
143
-
144
-
145
-
146
-
147
-
148
-
149
-
150
-
151
-
152
-
153
-
154
-
155
-
156
-
157
-
158
-
159
-
160
-
161
-
162
-
163
-
164
-
165
-
166
-
167
-
168
-
169
-
170
-
171
-
172
-
173
-
174
-
175
-
176
-
177
-
178
-
179
-
180
-
181
-
182
-
183
-
184
-
185
-
186
-
187
-
188
-
189
-
190
-
191
-
192
-
193
-
194
-
195
-
196
-
197
-
198
-
199
-
200
-
201
-
202
-
203
-
204
-
205
-
206
-
207
-
208
-
209
-
210
-
211
-
212
-
213
-
214
-
215
-
216
-
217
-
218
-
219
-
220
-
221
-
222
-
223
-
224
-
225
-
226
-
227
-
228
-
229
-
230
-
231
-
232
-
233
-
234
-
235
-
236
-
237
-
238
-
239
-
240
-
241
-
242
-
243
-
244
-
245
-
246
-
247
-
248
-
249
-
250
-
251
-
252
-
253
-
254
-
255
-
256
-
257
-
258
-
259
-
260
-
261
-
262
-
263
-
264
-
265
-
266
-
267
-
268
-
269
-
270
-
271
-
272
-
273
-
274
-
275
-
276
 |
 |

Bank of America 2011 95
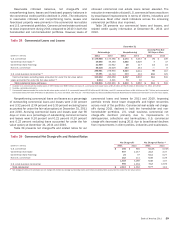
Table 46 presents our commercial TDRs by product type and status. U.S. small business commercial TDRs are comprised of
renegotiated business card loans and are not classified as nonperforming as they are charged off no later than the end of the month
in which the loan becomes 180 days past due.
Table 46
(Dollars in millions)
U.S. commercial
Commercial real estate
Non-U.S. commercial
U.S. small business commercial
Total commercial troubled debt restructurings
Commercial Troubled Debt Restructurings
December 31
2011
Total
$ 1,329
1,675
54
389
$ 3,447
Nonperforming
$531
1,076
38
—
$ 1,645
Performing
$798
599
16
389
$ 1,802
2010
Total
$ 356
815
19
688
$ 1,878
Nonperforming
$ 175
770
7
—
$ 952
Performing
$ 181
45
12
688
$ 926
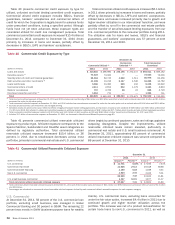
Industry Concentrations
Table 47 presents commercial committed and utilized credit
exposure by industry and the total net credit default protection
purchased to cover the funded and unfunded portions of certain
credit exposures. Our commercial credit exposure is diversified
across a broad range of industries. The increase in commercial
committed exposure of $10.4 billion in 2011 was concentrated
in banks, diversified financials and energy, partially offset by lower
real estate, insurance (including monolines) and other committed
exposure.
Industry limits are used internally to manage industry
concentrations and are based on committed exposures and capital
usage that are allocated on an industry-by-industry basis. A risk
management framework is in place to set and approve industry
limits as well as to provide ongoing monitoring. Management’s
Credit Risk Committee (CRC) oversees industry limit governance.
Diversified financials, our largest industry concentration,
experienced an increase in committed exposure of $8.2 billion, or
nine percent, in 2011 driven primarily by increases in consumer
finance lending and traded products exposure.
Real estate, our second largest industry concentration,
experienced a decrease in committed exposure of $9.4 billion, or
13 percent, in 2011 due primarily to paydowns and sales which
outpaced new originations and renewals. Real estate construction
and land development exposure represented 20 percent and 27
percent of the total real estate industry committed exposure at
December 31, 2011 and 2010. For more information on the
commercial real estate and related portfolios, see Commercial
Real Estate on page 91.
Committed exposure in the banking industry increased $9.1
billion, or 31 percent, in 2011 primarily due to increases in trade
finance as a result of momentum from regional economies and
growth initiatives in foreign markets.
Energy committed exposure increased $5.7 billion, or 22
percent, in 2011 due to increases in working capital lines for state-
related enterprises and increases in large investment-grade energy
companies.
Insurance, including monolines committed exposure,
decreased $8.3 billion, or 34 percent, in 2011 due primarily to
the settlement/termination of monoline positions. For more
information on our monoline exposure, see Monoline and Related
Exposure below.
Other committed exposure decreased $6.0 billion, or 44
percent, in 2011 due to reductions primarily in traded products
exposure.
The Corporation’s committed state and municipal exposure of
$46.1 billion at December 31, 2011 consisted of $34.4 billion of
commercial utilized exposure (including $18.6 billion of funded
loans, $11.3 billion of SBLCs and $4.1 billion of derivative assets)
and unutilized commercial exposure of $11.7 billion (primarily
unfunded loan commitments and letters of credit) and is reported
in the Government and public education industry in Table 47.
Economic conditions continue to impact debt issued by state and
local municipalities and certain exposures to these municipalities.
While historical default rates have been low, as part of our overall
and ongoing risk management processes, we continually monitor
these exposures through a rigorous review process. Additionally,
internal communications surrounding certain at-risk
counterparties and/or sectors are regularly circulated ensuring
exposure levels are in compliance with established concentration
guidelines.
Monoline and Related Exposure
Monoline exposure is reported in the insurance industry and
managed under insurance portfolio industry limits.
We have indirect exposure to monolines primarily in the form
of guarantees supporting our loans, investment portfolios,
securitizations and credit-enhanced securities as part of our public
finance business and other selected products. Such indirect
exposure exists when we purchase credit protection from
monolines to hedge all or a portion of the credit risk on certain
credit exposures including loans and CDOs. We underwrite our
public finance exposure by evaluating the underlying securities.
We also have indirect exposure to monolines in the form of
guarantees supporting our mortgage and other loan sales. Indirect
exposure may exist when credit protection was purchased from
monolines to hedge all or a portion of the credit risk on certain
mortgage and other loan exposures. A loss may occur when we
are required to repurchase a loan and the market value of the loan
has declined, or we are required to indemnify or provide recourse
for a guarantor’s loss. For additional information regarding our
exposure to representations and warranties, see Off-Balance
Sheet Arrangements and Contractual Obligations –
Representations and Warranties on page 50 and Note 9 –
Representations and Warranties Obligations and Corporate
Guarantees to the Consolidated Financial Statements.