Bank of America 2011 Annual Report Download - page 51
Download and view the complete annual report
Please find page 51 of the 2011 Bank of America annual report below. You can navigate through the pages in the report by either clicking on the pages listed below, or by using the keyword search tool below to find specific information within the annual report.-
 1
1 -
2
-
3
-
4
-
5
-
6
-
7
-
8
-
9
-
10
-
11
-
12
-
13
-
14
-
15
-
16
-
17
-
18
-
19
-
20
-
21
-
22
-
23
-
24
-
25
-
26
-
27
-
28
-
29
-
30
-
31
-
32
-
33
-
34
-
35
-
36
-
37
-
38
-
39
-
40
-
 41
41 -
 42
42 -
 43
43 -
 44
44 -
 45
45 -
 46
46 -
 47
47 -
 48
48 -
 49
49 -
 50
50 -
 51
51 -
 52
52 -
 53
53 -
 54
54 -
 55
55 -
 56
56 -
 57
57 -
 58
58 -
 59
59 -
 60
60 -
 61
61 -
62
-
63
-
64
-
65
-
66
-
67
-
68
-
69
-
70
-
71
-
72
-
73
-
74
-
75
-
76
-
77
-
78
-
79
-
80
-
81
-
82
-
83
-
84
-
85
-
86
-
87
-
88
-
89
-
90
-
91
-
92
-
93
-
94
-
95
-
96
-
97
-
98
-
99
-
100
-
101
-
102
-
103
-
104
-
105
-
106
-
107
-
108
-
109
-
110
-
111
-
112
-
113
-
114
-
115
-
116
-
117
-
118
-
119
-
120
-
121
-
122
-
123
-
124
-
125
-
126
-
127
-
128
-
129
-
130
-
131
-
132
-
133
-
134
-
135
-
136
-
137
-
138
-
139
-
140
-
141
-
142
-
143
-
144
-
145
-
146
-
147
-
148
-
149
-
150
-
151
-
152
-
153
-
154
-
155
-
156
-
157
-
158
-
159
-
160
-
161
-
162
-
163
-
164
-
165
-
166
-
167
-
168
-
169
-
170
-
171
-
172
-
173
-
174
-
175
-
176
-
177
-
178
-
179
-
180
-
181
-
182
-
183
-
184
-
185
-
186
-
187
-
188
-
189
-
190
-
191
-
192
-
193
-
194
-
195
-
196
-
197
-
198
-
199
-
200
-
201
-
202
-
203
-
204
-
205
-
206
-
207
-
208
-
209
-
210
-
211
-
212
-
213
-
214
-
215
-
216
-
217
-
218
-
219
-
220
-
221
-
222
-
223
-
224
-
225
-
226
-
227
-
228
-
229
-
230
-
231
-
232
-
233
-
234
-
235
-
236
-
237
-
238
-
239
-
240
-
241
-
242
-
243
-
244
-
245
-
246
-
247
-
248
-
249
-
250
-
251
-
252
-
253
-
254
-
255
-
256
-
257
-
258
-
259
-
260
-
261
-
262
-
263
-
264
-
265
-
266
-
267
-
268
-
269
-
270
-
271
-
272
-
273
-
274
-
275
-
276
 |
 |

Bank of America 2011 49
for credit losses decreased $150 million to $6.2 billion driven by
lower balances due primarily to divestitures; improvements in
delinquencies, collections and insolvencies in the non-U.S. credit
card portfolio; and continued run-off in the legacy Merrill Lynch
commercial portfolio. These increases were largely offset by
reserve additions to the Countrywide PCI discontinued real estate
and residential mortgage portfolios and higher credit costs related
to the non-PCI residential mortgage portfolio due primarily to the
continuing decline in home prices.
The income tax benefit was $879 million compared to a benefit
of $3.9 billion for 2010. The factors affecting taxes in All Other
are discussed more fully in Financial Highlights – Income Tax
Expense on page 28.
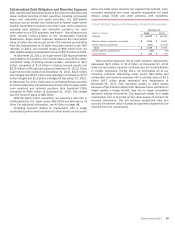
With the Merrill Lynch acquisition, we acquired a loan that is
collateralized by U.S. super senior ABS CDOs, with a current
carrying value of $3.1 billion at December 31, 2011, down from
$4.2 billion at December 31, 2010 primarily due to paydowns. The
loan is recorded in All Other and all scheduled payments on the
loan have been received to date. The loan matures in September
2023. For more information on our CDO exposure, see GBAM –
Collateralized Debt Obligation and Monoline Exposure on page 45.
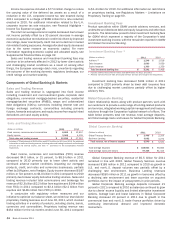
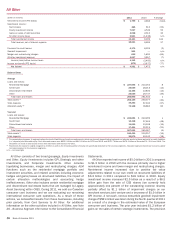
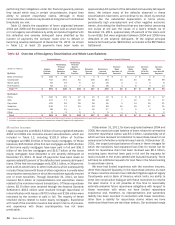
The tables below present the components of the equity
investments in All Other at December 31, 2011 and 2010, and
also a reconciliation to the total consolidated equity investment
income for 2011 and 2010.
Equity Investments
(Dollars in millions)
Global Principal Investments
Strategic and other investments
Total equity investments included in All Other
December 31
2011
$ 5,627
1,296
$ 6,923
2010
$ 11,640
22,545
$ 34,185
Equity Investment Income
(Dollars in millions)
Global Principal Investments
Strategic and other investments
Corporate Investments
Total equity investment income included in All
Other
Total equity investment income included in the
business segments
Total consolidated equity investment income
2011
$ 392
6,645
—
7,037
323
$ 7,360
2010
$ 2,299
2,543
(293)
4,549
711
$ 5,260
Equity investments included in All Other decreased $27.3
billion during 2011 consistent with our continued efforts to reduce
non-core assets including reducing both higher risk-weighted
assets and assets currently deducted, or expected to be deducted
under Basel III, from regulatory capital. For more information, see
Capital Management – Regulatory Capital Changes on page 67.
GPI is comprised of a diversified portfolio of investments in
private equity, real estate and other alternative investments. These
investments are made either directly in a company or held through
a fund with related income recorded in equity investment income.
GPI had unfunded equity commitments of $710 million and $1.4
billion at December 31, 2011 and 2010 related to certain of these
investments. The Corporation has actively reduced these
commitments in a series of transactions involving its private equity
fund investments.
Strategic and other investments included in All Other decreased
$21.2 billion during 2011. The decrease was primarily the result
of the sale of CCB shares and all of our investment in BlackRock
during 2011. In connection with the sale of our investment in CCB,
we recorded gains of $6.5 billion. At December 31, 2011 and
2010, we owned 2.0 billion shares and 25.6 billion shares
representing approximately one percent and 10 percent of CCB.
Sales restrictions on the remaining 2.0 billion CCB shares continue
until August 2013 and accordingly these shares are carried at
cost. At December 31, 2011 and 2010, the cost basis of our total
investment in CCB was $716 million and $9.2 billion, the carrying
value was $716 million and $19.7 billion, and the fair value was
$1.4 billion and $20.8 billion. During 2011 and 2010, we recorded
dividends of $836 million and $535 million from CCB. During
2011, we sold our remaining ownership interest of approximately
13.6 million preferred shares, or seven percent of BlackRock. In
connection with the sale, we recorded a gain of $377 million. For
more information, see Note 5 – Securities to the Consolidated
Financial Statements.
During 2011, we recorded $1.1 billion of impairment charges
on our merchant services joint venture. The joint venture had a
carrying value of $3.4 billion and $4.7 billion at December 31,
2011 and 2010 with the reduction in carrying value primarily the
result of the impairment charges. The impairment charges were
based on the ongoing financial performance of the joint venture
and updated forecasts of its long-term financial performance.
Because of the recent transfer of the joint venture investment from
GBAM to Global Commercial Banking, the impairment charges were
recorded in All Other. For additional information, see Note 5 –
Securities to the Consolidated Financial Statements.