Bank of America 2011 Annual Report Download - page 239
Download and view the complete annual report
Please find page 239 of the 2011 Bank of America annual report below. You can navigate through the pages in the report by either clicking on the pages listed below, or by using the keyword search tool below to find specific information within the annual report.-
 1
1 -
2
-
3
-
4
-
5
-
6
-
7
-
8
-
9
-
10
-
11
-
12
-
13
-
14
-
15
-
16
-
17
-
18
-
19
-
20
-
21
-
22
-
23
-
24
-
25
-
26
-
27
-
28
-
29
-
30
-
31
-
32
-
33
-
34
-
35
-
36
-
37
-
38
-
39
-
40
-
41
-
42
-
43
-
44
-
45
-
46
-
47
-
48
-
49
-
50
-
51
-
52
-
53
-
54
-
55
-
56
-
57
-
58
-
59
-
60
-
61
-
62
-
63
-
64
-
65
-
66
-
67
-
68
-
69
-
70
-
71
-
72
-
73
-
74
-
75
-
76
-
77
-
78
-
79
-
80
-
81
-
82
-
83
-
84
-
85
-
86
-
87
-
88
-
89
-
90
-
91
-
92
-
93
-
94
-
95
-
96
-
97
-
98
-
99
-
100
-
101
-
102
-
103
-
104
-
105
-
106
-
107
-
108
-
109
-
110
-
111
-
112
-
113
-
114
-
115
-
116
-
117
-
118
-
119
-
120
-
121
-
122
-
123
-
124
-
125
-
126
-
127
-
128
-
129
-
130
-
131
-
132
-
133
-
134
-
135
-
136
-
137
-
138
-
139
-
140
-
141
-
142
-
143
-
144
-
145
-
146
-
147
-
148
-
149
-
150
-
151
-
152
-
153
-
154
-
155
-
156
-
157
-
158
-
159
-
160
-
161
-
162
-
163
-
164
-
165
-
166
-
167
-
168
-
169
-
170
-
171
-
172
-
173
-
174
-
175
-
176
-
177
-
178
-
179
-
180
-
181
-
182
-
183
-
184
-
185
-
186
-
187
-
188
-
189
-
190
-
191
-
192
-
193
-
194
-
195
-
196
-
197
-
198
-
199
-
200
-
201
-
202
-
203
-
204
-
205
-
206
-
207
-
208
-
209
-
210
-
211
-
212
-
213
-
214
-
215
-
216
-
217
-
218
-
219
-
220
-
221
-
222
-
223
-
224
-
225
-
226
-
227
-
228
-
 229
229 -
 230
230 -
 231
231 -
 232
232 -
 233
233 -
 234
234 -
 235
235 -
 236
236 -
 237
237 -
 238
238 -
 239
239 -
 240
240 -
 241
241 -
 242
242 -
 243
243 -
 244
244 -
 245
245 -
 246
246 -
 247
247 -
 248
248 -
 249
249 -
250
-
251
-
252
-
253
-
254
-
255
-
256
-
257
-
258
-
259
-
260
-
261
-
262
-
263
-
264
-
265
-
266
-
267
-
268
-
269
-
270
-
271
-
272
-
273
-
274
-
275
-
276
 |
 |

Bank of America 2011 237
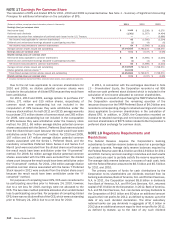
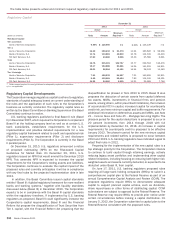
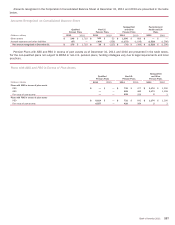
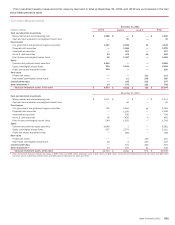
Amounts recognized in the Corporation’s Consolidated Balance Sheet at December 31, 2011 and 2010 are presented in the table
below.
Amounts Recognized on Consolidated Balance Sheet
(Dollars in millions)
Other assets
Accrued expenses and other liabilities
Net amount recognized at December 31
Qualified
Pension Plans
2011
$ 246
(67)
$ 179
2010
$ 1,710
—
$ 1,710
Non-U.S.
Pension Plans
2011
$342
(304)
$38
2010
$33
(258)
$ (225)
Nonqualified
and Other
Pension Plans
2011
$ 1,096
(1,172)
$ (76)
2010
$ 809
(1,198)
$ (389)
Postretirement
Health and Life
Plans
2011
$—
(1,528)
$(1,528)
2010
$—
(1,596)
$ (1,596)
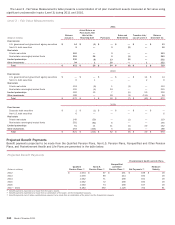
Pension Plans with ABO and PBO in excess of plan assets as of December 31, 2011 and 2010 are presented in the table below.
For the non-qualified plans not subject to ERISA or non-U.S. pension plans, funding strategies vary due to legal requirements and local
practices.
Plans with ABO and PBO in Excess of Plan Assets
(Dollars in millions)
Plans with ABO in excess of plan assets
PBO
ABO
Fair value of plan assets
Plans with PBO in excess of plan assets
PBO
Fair value of plan assets
Qualified
Pension Plans
2011
$—
—
—
$ 6,624
6,557
2010
$—
—
—
$—
—
Non-U.S.
Pension Plans
2011
$732
698
428
$732
428
2010
$ 477
466
259
$ 642
384
Nonqualified
and Other
Pension Plans
2011
$ 1,174
1,173
2
$ 1,174
2
2010
$ 1,200
1,199
2
$ 1,200
2