Bank of America 2011 Annual Report Download - page 79
Download and view the complete annual report
Please find page 79 of the 2011 Bank of America annual report below. You can navigate through the pages in the report by either clicking on the pages listed below, or by using the keyword search tool below to find specific information within the annual report.-
 1
1 -
2
-
3
-
4
-
5
-
6
-
7
-
8
-
9
-
10
-
11
-
12
-
13
-
14
-
15
-
16
-
17
-
18
-
19
-
20
-
21
-
22
-
23
-
24
-
25
-
26
-
27
-
28
-
29
-
30
-
31
-
32
-
33
-
34
-
35
-
36
-
37
-
38
-
39
-
40
-
41
-
42
-
43
-
44
-
45
-
46
-
47
-
48
-
49
-
50
-
51
-
52
-
53
-
54
-
55
-
56
-
57
-
58
-
59
-
60
-
61
-
62
-
63
-
64
-
65
-
66
-
67
-
68
-
 69
69 -
 70
70 -
 71
71 -
 72
72 -
 73
73 -
 74
74 -
 75
75 -
 76
76 -
 77
77 -
 78
78 -
 79
79 -
 80
80 -
 81
81 -
 82
82 -
 83
83 -
 84
84 -
 85
85 -
 86
86 -
 87
87 -
 88
88 -
 89
89 -
90
-
91
-
92
-
93
-
94
-
95
-
96
-
97
-
98
-
99
-
100
-
101
-
102
-
103
-
104
-
105
-
106
-
107
-
108
-
109
-
110
-
111
-
112
-
113
-
114
-
115
-
116
-
117
-
118
-
119
-
120
-
121
-
122
-
123
-
124
-
125
-
126
-
127
-
128
-
129
-
130
-
131
-
132
-
133
-
134
-
135
-
136
-
137
-
138
-
139
-
140
-
141
-
142
-
143
-
144
-
145
-
146
-
147
-
148
-
149
-
150
-
151
-
152
-
153
-
154
-
155
-
156
-
157
-
158
-
159
-
160
-
161
-
162
-
163
-
164
-
165
-
166
-
167
-
168
-
169
-
170
-
171
-
172
-
173
-
174
-
175
-
176
-
177
-
178
-
179
-
180
-
181
-
182
-
183
-
184
-
185
-
186
-
187
-
188
-
189
-
190
-
191
-
192
-
193
-
194
-
195
-
196
-
197
-
198
-
199
-
200
-
201
-
202
-
203
-
204
-
205
-
206
-
207
-
208
-
209
-
210
-
211
-
212
-
213
-
214
-
215
-
216
-
217
-
218
-
219
-
220
-
221
-
222
-
223
-
224
-
225
-
226
-
227
-
228
-
229
-
230
-
231
-
232
-
233
-
234
-
235
-
236
-
237
-
238
-
239
-
240
-
241
-
242
-
243
-
244
-
245
-
246
-
247
-
248
-
249
-
250
-
251
-
252
-
253
-
254
-
255
-
256
-
257
-
258
-
259
-
260
-
261
-
262
-
263
-
264
-
265
-
266
-
267
-
268
-
269
-
270
-
271
-
272
-
273
-
274
-
275
-
276
 |
 |

Bank of America 2011 77
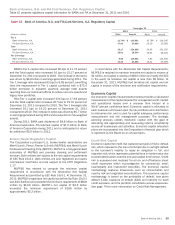
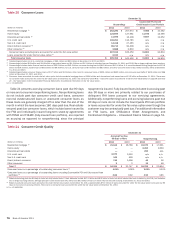
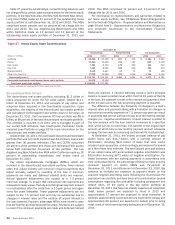
Table 22 presents net charge-offs and related ratios for consumer loans and leases for 2011 and 2010.
Table 22
(Dollars in millions)
Residential mortgage
Home equity
Discontinued real estate
U.S. credit card
Non-U.S. credit card
Direct/Indirect consumer
Other consumer
Total
Consumer Net Charge-offs and Related Ratios
Net Charge-offs
2011
$ 3,832
4,473
92
7,276
1,169
1,476
202
$ 18,520
2010
$ 3,670
6,781
68
13,027
2,207
3,336
261
$ 29,350
Net Charge-off Ratios (1)
2011
1.45%
3.42
0.75
6.90
4.86
1.64
7.32
2.94
2010
1.49%
4.65
0.49
11.04
7.88
3.45
8.89
4.51
(1) Net charge-off ratios are calculated as net charge-offs divided by average outstanding loans excluding loans accounted for under the fair value option.
Net charge-off ratios excluding the Countrywide PCI and fully-
insured loan portfolios were 2.27 percent and 1.86 percent for
residential mortgage, 3.77 percent and 5.10 percent for home
equity, 7.14 percent and 4.20 percent for discontinued real estate
and 3.62 percent and 5.08 percent for the total consumer portfolio
for 2011 and 2010. These are the only product classifications
materially impacted by the Countrywide PCI and fully-insured loan
portfolios for 2011 and 2010.
Legacy Asset Servicing within CRES manages our exposures to
certain residential mortgage, home equity and discontinued real
estate products. Legacy Asset Servicing manages both our owned
loans, as well as loans serviced for others, that meet certain
criteria. The criteria generally represent home lending standards
which we do not consider as part of our continuing core business.
The Legacy Asset Servicing portfolio includes the following:
Discontinued real estate loans including subprime and pay
option
Residential mortgage loans and home equity loans for products
we no longer originate including reduced document loans and
interest-only loans not underwritten to fully amortizing payment
Loans that would not have been originated under our
underwriting standards at December 31, 2010 including
conventional loans with an original loan-to-value (LTV) greater
than 95 percent and government-insured loans for which the
borrower has a FICO score less than 620
Countrywide PCI loan portfolios
Certain loans that met a pre-defined delinquency and probability
of default threshold as of January 1, 2011
For more information on Legacy Asset Servicing within CRES,
see page 37.
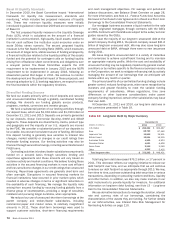
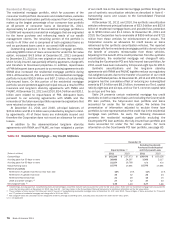
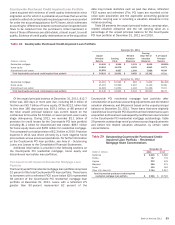
Table 23 presents outstandings, nonperforming balances and
net charge-offs by the Core portfolio and the Legacy Asset Servicing
portfolio for the home loans portfolio.
Table 23
(Dollars in millions)
Core portfolio
Residential mortgage
Home equity
Legacy Asset Servicing portfolio
Residential mortgage (1)
Home equity
Discontinued real estate (1)
Home loans portfolio
Residential mortgage
Home equity
Discontinued real estate
Total home loans portfolio
Home Loans Portfolio
December 31
Outstandings
2011
$ 178,337
67,055
83,953
57,644
11,095
262,290
124,699
11,095
$ 398,084
2010
$166,927
71,519
91,046
66,462
13,108
257,973
137,981
13,108
$409,062
Nonperforming
2011
$ 2,414
439
13,556
2,014
290
15,970
2,453
290
$ 18,713
2010
$ 1,510
107
16,181
2,587
331
17,691
2,694
331
$ 20,716
Net
Charge-offs
2011
$ 348
501
3,484
3,972
92
3,832
4,473
92
$ 8,397
(1) Balances exclude consumer loans accounted for under the fair value option of $906 million for residential mortgage loans and $1.3 billion for discontinued real estate loans at December 31, 2011.
There were no consumer loans accounted for under the fair value option at December 31, 2010. See Note 23 – Fair Value Option to the Consolidated Financial Statements for additional information
on the fair value option.
We believe that the presentation of information adjusted to
exclude the impact of the Countrywide PCI loan portfolio, the fully-
insured loan portfolio and loans accounted for under the fair value
option is more representative of the ongoing operations and credit
quality of the business. As a result, in the following discussions
of the residential mortgage, home equity and discontinued real
estate portfolios, we provide information that excludes the impact
of the Countrywide PCI loan portfolio, the fully-insured loan portfolio
and loans accounted for under the fair value option in certain credit
quality statistics. We separately disclose information on the
Countrywide PCI loan portfolios on page 83.