Bank of America 2011 Annual Report Download - page 210
Download and view the complete annual report
Please find page 210 of the 2011 Bank of America annual report below. You can navigate through the pages in the report by either clicking on the pages listed below, or by using the keyword search tool below to find specific information within the annual report.-
 1
1 -
2
-
3
-
4
-
5
-
6
-
7
-
8
-
9
-
10
-
11
-
12
-
13
-
14
-
15
-
16
-
17
-
18
-
19
-
20
-
21
-
22
-
23
-
24
-
25
-
26
-
27
-
28
-
29
-
30
-
31
-
32
-
33
-
34
-
35
-
36
-
37
-
38
-
39
-
40
-
41
-
42
-
43
-
44
-
45
-
46
-
47
-
48
-
49
-
50
-
51
-
52
-
53
-
54
-
55
-
56
-
57
-
58
-
59
-
60
-
61
-
62
-
63
-
64
-
65
-
66
-
67
-
68
-
69
-
70
-
71
-
72
-
73
-
74
-
75
-
76
-
77
-
78
-
79
-
80
-
81
-
82
-
83
-
84
-
85
-
86
-
87
-
88
-
89
-
90
-
91
-
92
-
93
-
94
-
95
-
96
-
97
-
98
-
99
-
100
-
101
-
102
-
103
-
104
-
105
-
106
-
107
-
108
-
109
-
110
-
111
-
112
-
113
-
114
-
115
-
116
-
117
-
118
-
119
-
120
-
121
-
122
-
123
-
124
-
125
-
126
-
127
-
128
-
129
-
130
-
131
-
132
-
133
-
134
-
135
-
136
-
137
-
138
-
139
-
140
-
141
-
142
-
143
-
144
-
145
-
146
-
147
-
148
-
149
-
150
-
151
-
152
-
153
-
154
-
155
-
156
-
157
-
158
-
159
-
160
-
161
-
162
-
163
-
164
-
165
-
166
-
167
-
168
-
169
-
170
-
171
-
172
-
173
-
174
-
175
-
176
-
177
-
178
-
179
-
180
-
181
-
182
-
183
-
184
-
185
-
186
-
187
-
188
-
189
-
190
-
191
-
192
-
193
-
194
-
195
-
196
-
197
-
198
-
199
-
 200
200 -
 201
201 -
 202
202 -
 203
203 -
 204
204 -
 205
205 -
 206
206 -
 207
207 -
 208
208 -
 209
209 -
 210
210 -
 211
211 -
 212
212 -
 213
213 -
 214
214 -
 215
215 -
 216
216 -
 217
217 -
 218
218 -
 219
219 -
 220
220 -
221
-
222
-
223
-
224
-
225
-
226
-
227
-
228
-
229
-
230
-
231
-
232
-
233
-
234
-
235
-
236
-
237
-
238
-
239
-
240
-
241
-
242
-
243
-
244
-
245
-
246
-
247
-
248
-
249
-
250
-
251
-
252
-
253
-
254
-
255
-
256
-
257
-
258
-
259
-
260
-
261
-
262
-
263
-
264
-
265
-
266
-
267
-
268
-
269
-
270
-
271
-
272
-
273
-
274
-
275
-
276
 |
 |

208 Bank of America 2011
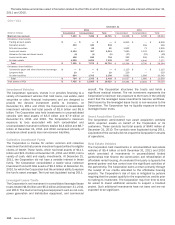
During the three months ended December 31, 2010, the
Corporation performed a goodwill impairment test for the CRES
reporting unit as it was likely that there was a decline in its fair
value as a result of increased uncertainties, including existing and
potential litigation exposure and other related risks, higher
servicing costs including those related to loss mitigation,
foreclosure related issues and the redeployment of centralized
sales resources. The Corporation concluded that goodwill was
impaired, and accordingly, recorded a non-cash, non-tax deductible
goodwill impairment charge of $2.0 billion in CRES.
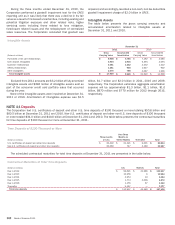
Intangible Assets
The table below presents the gross carrying amounts and
accumulated amortization related to intangible assets at
December 31, 2011 and 2010.
Intangible Assets
(Dollars in millions)
Purchased credit card relationships
Core deposit intangibles
Customer relationships
Affinity relationships
Other intangibles
Total intangible assets
December 31
2011
Gross
Carrying Value
$ 5,938
3,903
4,081
1,551
2,476
$ 17,949
Accumulated
Amortization
$ 3,765
2,915
1,532
948
768
$ 9,928
2010
Gross
Carrying Value
$ 7,162
5,394
4,232
1,647
3,087
$ 21,522
Accumulated
Amortization
$ 4,085
4,094
1,222
902
1,296
$ 11,599
Excluded from 2011 amounts are $3.2 billion of fully amortized
intangible assets and $396 million of intangible assets sold as
part of the consumer credit card portfolio sales that occurred
during the year.
None of the intangible assets were impaired at December 31,
2011 or 2010. Amortization of intangibles expense was $1.5
billion, $1.7 billion and $2.0 billion in 2011, 2010 and 2009,
respectively. The Corporation estimates aggregate amortization
expense will be approximately $1.3 billion, $1.1 billion, $1.0
billion, $870 million and $770 million for 2012 through 2016,
respectively.
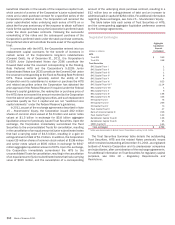
NOTE 11 Deposits
The Corporation had U.S. certificates of deposit and other U.S. time deposits of $100 thousand or more totaling $50.8 billion and
$60.5 billion at December 31, 2011 and 2010. Non-U.S. certificates of deposit and other non-U.S. time deposits of $100 thousand
or more totaled $34.0 billion and $40.6 billion at December 31, 2011 and 2010. The table below presents the contractual maturities
for time deposits of $100 thousand or more at December 31, 2011.
Time Deposits of $100 Thousand or More
(Dollars in millions)
U.S. certificates of deposit and other time deposits
Non-U.S. certificates of deposit and other time deposits
Three months
or Less
$ 20,402
30,060
Over Three
Months to
Twelve Months
$ 21,321
747
Thereafter
$ 9,091
3,180
Total
$ 50,814
33,987
The scheduled contractual maturities for total time deposits at December 31, 2011 are presented in the table below.
Contractual Maturities of Total Time Deposits
(Dollars in millions)
Due in 2012
Due in 2013
Due in 2014
Due in 2015
Due in 2016
Thereafter
Total time deposits
U.S.
$ 92,621
10,956
3,254
1,774
1,155
3,197
$112,957
Non-U.S.
$ 41,286
8
10
3,098
67
—
$ 44,469
Total
$ 133,907
10,964
3,264
4,872
1,222
3,197
$ 157,426