Bank of America 2011 Annual Report Download - page 186
Download and view the complete annual report
Please find page 186 of the 2011 Bank of America annual report below. You can navigate through the pages in the report by either clicking on the pages listed below, or by using the keyword search tool below to find specific information within the annual report.-
 1
1 -
2
-
3
-
4
-
5
-
6
-
7
-
8
-
9
-
10
-
11
-
12
-
13
-
14
-
15
-
16
-
17
-
18
-
19
-
20
-
21
-
22
-
23
-
24
-
25
-
26
-
27
-
28
-
29
-
30
-
31
-
32
-
33
-
34
-
35
-
36
-
37
-
38
-
39
-
40
-
41
-
42
-
43
-
44
-
45
-
46
-
47
-
48
-
49
-
50
-
51
-
52
-
53
-
54
-
55
-
56
-
57
-
58
-
59
-
60
-
61
-
62
-
63
-
64
-
65
-
66
-
67
-
68
-
69
-
70
-
71
-
72
-
73
-
74
-
75
-
76
-
77
-
78
-
79
-
80
-
81
-
82
-
83
-
84
-
85
-
86
-
87
-
88
-
89
-
90
-
91
-
92
-
93
-
94
-
95
-
96
-
97
-
98
-
99
-
100
-
101
-
102
-
103
-
104
-
105
-
106
-
107
-
108
-
109
-
110
-
111
-
112
-
113
-
114
-
115
-
116
-
117
-
118
-
119
-
120
-
121
-
122
-
123
-
124
-
125
-
126
-
127
-
128
-
129
-
130
-
131
-
132
-
133
-
134
-
135
-
136
-
137
-
138
-
139
-
140
-
141
-
142
-
143
-
144
-
145
-
146
-
147
-
148
-
149
-
150
-
151
-
152
-
153
-
154
-
155
-
156
-
157
-
158
-
159
-
160
-
161
-
162
-
163
-
164
-
165
-
166
-
167
-
168
-
169
-
170
-
171
-
172
-
173
-
174
-
175
-
 176
176 -
 177
177 -
 178
178 -
 179
179 -
 180
180 -
 181
181 -
 182
182 -
 183
183 -
 184
184 -
 185
185 -
 186
186 -
 187
187 -
 188
188 -
 189
189 -
 190
190 -
 191
191 -
 192
192 -
 193
193 -
 194
194 -
 195
195 -
 196
196 -
197
-
198
-
199
-
200
-
201
-
202
-
203
-
204
-
205
-
206
-
207
-
208
-
209
-
210
-
211
-
212
-
213
-
214
-
215
-
216
-
217
-
218
-
219
-
220
-
221
-
222
-
223
-
224
-
225
-
226
-
227
-
228
-
229
-
230
-
231
-
232
-
233
-
234
-
235
-
236
-
237
-
238
-
239
-
240
-
241
-
242
-
243
-
244
-
245
-
246
-
247
-
248
-
249
-
250
-
251
-
252
-
253
-
254
-
255
-
256
-
257
-
258
-
259
-
260
-
261
-
262
-
263
-
264
-
265
-
266
-
267
-
268
-
269
-
270
-
271
-
272
-
273
-
274
-
275
-
276
 |
 |

184 Bank of America 2011
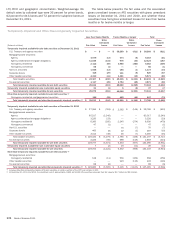
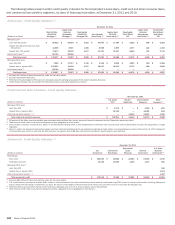
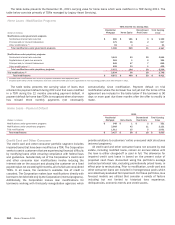
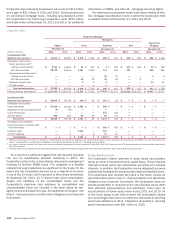
The table below presents the December 31, 2011 carrying value for home loans which were modified in a TDR during 2011. The
table below consists primarily of TDRs managed by Legacy Asset Servicing.
Home Loans - Modification Programs
(Dollars in millions)
Modifications under government programs
Contractual interest rate reduction
Principal and/or interest forbearance
Other modifications (1)
Total modifications under government programs
Modifications under proprietary programs
Contractual interest rate reduction
Capitalization of past due amounts
Principal and/or interest forbearance
Other modifications (1)
Total modifications under proprietary programs
Trial modifications (2)
Total modifications
TDRs Entered into During 2011
Residential
Mortgage
$ 969
179
18
1,166
3,441
381
845
405
5,072
2,634
$ 8,872
Home Equity
$ 181
36
3
220
83
1
47
33
164
96
$ 480
Discontinued
Real Estate
$9
2
—
11
20
2
7
1
30
18
$59
Total Carrying
Value
$ 1,159
217
21
1,397
3,544
384
899
439
5,266
2,748
$ 9,411
(1) Includes other modifications such as term or payment extensions and repayment plans.
(2) Includes $187 million of trial modifications that were considered TDRs prior to the application of new accounting guidance that was effective in 2011.
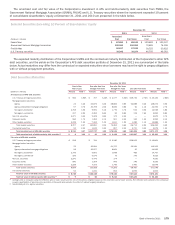
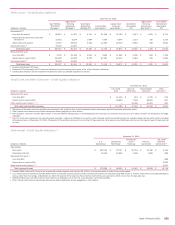
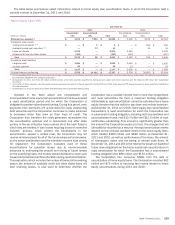
The table below presents the carrying value of loans that
entered into payment default during 2011 and that were modified
in a TDR during the 12 months preceding payment default. A
payment default for home loan TDRs is recognized when a borrower
has missed three monthly payments (not necessarily
consecutively) since modification. Payment default on trial
modification where the borrower has not yet met the terms of the
agreement are included in the table below if the borrower is 90
days or more past due three months after the offer to modify is
made.
Home Loans - Payment Default
(Dollars in millions)
Modifications under government programs
Modifications under proprietary programs
Trial modifications
Total modifications
2011
Residential
Mortgage
$348
2,068
1,011
$ 3,427
Home Equity
$1
42
15
$58
Discontinued
Real Estate
$2
11
5
$18
Total Carrying
Value
$ 351
2,121
1,031
$ 3,503
Credit Card and Other Consumer
The credit card and other consumer portfolio segment includes
impaired loans that have been modified as a TDR. The Corporation
seeks to assist customers that are experiencing financial difficulty
by modifying loans while ensuring compliance with federal laws
and guidelines. Substantially all of the Corporation’s credit card
and other consumer loan modifications involve reducing the
interest rate on the account and placing the customer on a fixed
payment plan not exceeding 60 months, all of which are considered
TDRs. In all cases, the customer’s available line of credit is
canceled. The Corporation makes loan modifications directly with
borrowers for debt held only by the Corporation (internal programs).
Additionally, the Corporation makes loan modifications for
borrowers working with third-party renegotiation agencies which
provide solutions to customers’ entire unsecured debt structures
(external programs).
All credit card and other consumer loans not secured by real
estate, including modified loans, remain on accrual status until
the loan is either charged-off or paid in full. The allowance for
impaired credit card loans is based on the present value of
projected cash flows discounted using the portfolio’s average
contractual interest rate, excluding promotionally priced loans, in
effect prior to restructuring. Prior to modification, credit card and
other consumer loans are included in homogeneous pools which
are collectively evaluated for impairment. For these portfolios, loss
forecast models are utilized that consider a variety of factors
including but not limited to historical loss experience,
delinquencies, economic trends and credit scores.