Bank of America 2011 Annual Report Download - page 233
Download and view the complete annual report
Please find page 233 of the 2011 Bank of America annual report below. You can navigate through the pages in the report by either clicking on the pages listed below, or by using the keyword search tool below to find specific information within the annual report.-
 1
1 -
2
-
3
-
4
-
5
-
6
-
7
-
8
-
9
-
10
-
11
-
12
-
13
-
14
-
15
-
16
-
17
-
18
-
19
-
20
-
21
-
22
-
23
-
24
-
25
-
26
-
27
-
28
-
29
-
30
-
31
-
32
-
33
-
34
-
35
-
36
-
37
-
38
-
39
-
40
-
41
-
42
-
43
-
44
-
45
-
46
-
47
-
48
-
49
-
50
-
51
-
52
-
53
-
54
-
55
-
56
-
57
-
58
-
59
-
60
-
61
-
62
-
63
-
64
-
65
-
66
-
67
-
68
-
69
-
70
-
71
-
72
-
73
-
74
-
75
-
76
-
77
-
78
-
79
-
80
-
81
-
82
-
83
-
84
-
85
-
86
-
87
-
88
-
89
-
90
-
91
-
92
-
93
-
94
-
95
-
96
-
97
-
98
-
99
-
100
-
101
-
102
-
103
-
104
-
105
-
106
-
107
-
108
-
109
-
110
-
111
-
112
-
113
-
114
-
115
-
116
-
117
-
118
-
119
-
120
-
121
-
122
-
123
-
124
-
125
-
126
-
127
-
128
-
129
-
130
-
131
-
132
-
133
-
134
-
135
-
136
-
137
-
138
-
139
-
140
-
141
-
142
-
143
-
144
-
145
-
146
-
147
-
148
-
149
-
150
-
151
-
152
-
153
-
154
-
155
-
156
-
157
-
158
-
159
-
160
-
161
-
162
-
163
-
164
-
165
-
166
-
167
-
168
-
169
-
170
-
171
-
172
-
173
-
174
-
175
-
176
-
177
-
178
-
179
-
180
-
181
-
182
-
183
-
184
-
185
-
186
-
187
-
188
-
189
-
190
-
191
-
192
-
193
-
194
-
195
-
196
-
197
-
198
-
199
-
200
-
201
-
202
-
203
-
204
-
205
-
206
-
207
-
208
-
209
-
210
-
211
-
212
-
213
-
214
-
215
-
216
-
217
-
218
-
219
-
220
-
221
-
222
-
 223
223 -
 224
224 -
 225
225 -
 226
226 -
 227
227 -
 228
228 -
 229
229 -
 230
230 -
 231
231 -
 232
232 -
 233
233 -
 234
234 -
 235
235 -
 236
236 -
 237
237 -
 238
238 -
 239
239 -
 240
240 -
 241
241 -
 242
242 -
 243
243 -
244
-
245
-
246
-
247
-
248
-
249
-
250
-
251
-
252
-
253
-
254
-
255
-
256
-
257
-
258
-
259
-
260
-
261
-
262
-
263
-
264
-
265
-
266
-
267
-
268
-
269
-
270
-
271
-
272
-
273
-
274
-
275
-
276
 |
 |

Bank of America 2011 231
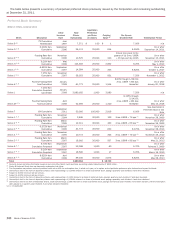
Series L Preferred Stock listed in the Preferred Stock Summary
table does not have early redemption/call rights. Each share of
the Series L Preferred Stock may be converted at any time, at the
option of the holder, into 20 shares of the Corporation’s common
stock plus cash in lieu of fractional shares. On or after January
30, 2013, the Corporation may cause some or all of the Series L
Preferred Stock, at its option, at any time or from time to time, to
be converted into shares of common stock at the then-applicable
conversion rate if, for 20 trading days during any period of 30
consecutive trading days, the closing price of common stock
exceeds 130 percent of the then-applicable conversion price of
the Series L Preferred Stock. If the Corporation exercises its rights
to cause the automatic conversion of Series L Preferred Stock on
January 30, 2013, it will still pay any accrued dividends payable
on January 30, 2013 to the applicable holders of record.
All series of preferred stock in the Preferred Stock Summary
table have a par value of $0.01 per share, are not subject to the
operation of a sinking fund, have no participation rights, and with
the exception of the Series L Preferred Stock, are not convertible.
The holders of the Series B Preferred Stock and Series 1 through
8 Preferred Stock have general voting rights, and the holders of
the other series included in the table have no general voting rights.
All outstanding series of preferred stock of the Corporation have
preference over the Corporation’s common stock with respect to
the payment of dividends and distribution of the Corporation’s
assets in the event of a liquidation or dissolution. With the
exception of the Series T Preferred Stock, if any dividend payable
on these series is in arrears for three or more semi-annual or six
or more quarterly dividend periods, as applicable (whether
consecutive or not), the holders of these series and any other
class or series of preferred stock ranking equally as to payment
of dividends and upon which equivalent voting rights have been
conferred and are exercisable (voting as a single class), will be
entitled to vote for the election of two additional directors. These
voting rights terminate when the Corporation has paid in full
dividends on these series for at least two semi-annual or four
quarterly dividend periods, as applicable, following the dividend
arrearage.
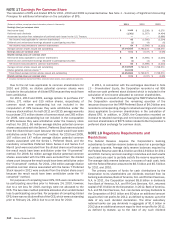
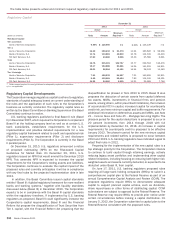
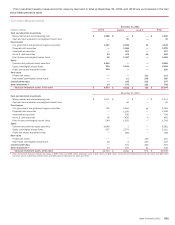
NOTE 16 Accumulated Other Comprehensive Income
The table below presents the changes in accumulated OCI in 2009, 2010 and 2011, net-of-tax.
(Dollars in millions)
Balance, December 31, 2008
Cumulative adjustment for accounting change – OTTI (3)
Net change in fair value recorded in accumulated OCI
Net realized (gains) losses reclassified into earnings
Balance, December 31, 2009
Cumulative adjustments for accounting changes: (3)
Consolidation of certain variable interest entities
Credit-related notes
Net change in fair value recorded in accumulated OCI
Net realized (gains) losses reclassified into earnings
Balance, December 31, 2010
Net change in fair value recorded in accumulated OCI
Net realized (gains) losses reclassified into earnings
Balance, December 31, 2011
Available-for-
Sale Debt
Securities
$ (5,956)
(71)
6,364
(965)
$ (628)
(116)
229
2,210
(981)
$ 714
4,331
(1,945)
$ 3,100
Available-for-
Sale Marketable
Equity Securities
$ 3,935
—
2,651
(4,457)
$ 2,129
—
—
5,657
(1,127)
$ 6,659
(2,539)
(4,117)
$3
Derivatives
$ (3,458)
—
153
770
$ (2,535)
—
—
(1,108)
407
$ (3,236)
(1,567)
1,018
$(3,785)
Employee
Benefit Plans (1)
$ (4,642)
—
318
232
$ (4,092)
—
—
(104)
249
$ (3,947)
(714)
270
$(4,391)
Foreign
Currency (2)
$ (704)
—
211
—
$ (493)
—
—
(44)
281
$ (256)
(34)
(74)
$(364)
Total
$ (10,825)
(71)
9,697
(4,420)
$ (5,619)
(116)
229
6,611
(1,171)
$ (66)
(523)
(4,848)
$ (5,437)
(1) Net change in fair value represents after-tax adjustments based on the final year-end actuarial valuations. For more information on employee benefit plans, see Note 19 – Employee Benefit Plans.
(2) Net change in fair value represents only the impact of changes in spot foreign exchange rates on the Corporation’s net investment in non-U.S. operations and related hedges.
(3) For additional information on the adoption of new accounting guidance, see Note 1 – Summary of Significant Accounting Principles and Note 5 – Securities.