Bank of America 2011 Annual Report Download - page 106
Download and view the complete annual report
Please find page 106 of the 2011 Bank of America annual report below. You can navigate through the pages in the report by either clicking on the pages listed below, or by using the keyword search tool below to find specific information within the annual report.-
 1
1 -
2
-
3
-
4
-
5
-
6
-
7
-
8
-
9
-
10
-
11
-
12
-
13
-
14
-
15
-
16
-
17
-
18
-
19
-
20
-
21
-
22
-
23
-
24
-
25
-
26
-
27
-
28
-
29
-
30
-
31
-
32
-
33
-
34
-
35
-
36
-
37
-
38
-
39
-
40
-
41
-
42
-
43
-
44
-
45
-
46
-
47
-
48
-
49
-
50
-
51
-
52
-
53
-
54
-
55
-
56
-
57
-
58
-
59
-
60
-
61
-
62
-
63
-
64
-
65
-
66
-
67
-
68
-
69
-
70
-
71
-
72
-
73
-
74
-
75
-
76
-
77
-
78
-
79
-
80
-
81
-
82
-
83
-
84
-
85
-
86
-
87
-
88
-
89
-
90
-
91
-
92
-
93
-
94
-
95
-
 96
96 -
 97
97 -
 98
98 -
 99
99 -
 100
100 -
 101
101 -
 102
102 -
 103
103 -
 104
104 -
 105
105 -
 106
106 -
 107
107 -
 108
108 -
 109
109 -
 110
110 -
 111
111 -
 112
112 -
 113
113 -
 114
114 -
 115
115 -
 116
116 -
117
-
118
-
119
-
120
-
121
-
122
-
123
-
124
-
125
-
126
-
127
-
128
-
129
-
130
-
131
-
132
-
133
-
134
-
135
-
136
-
137
-
138
-
139
-
140
-
141
-
142
-
143
-
144
-
145
-
146
-
147
-
148
-
149
-
150
-
151
-
152
-
153
-
154
-
155
-
156
-
157
-
158
-
159
-
160
-
161
-
162
-
163
-
164
-
165
-
166
-
167
-
168
-
169
-
170
-
171
-
172
-
173
-
174
-
175
-
176
-
177
-
178
-
179
-
180
-
181
-
182
-
183
-
184
-
185
-
186
-
187
-
188
-
189
-
190
-
191
-
192
-
193
-
194
-
195
-
196
-
197
-
198
-
199
-
200
-
201
-
202
-
203
-
204
-
205
-
206
-
207
-
208
-
209
-
210
-
211
-
212
-
213
-
214
-
215
-
216
-
217
-
218
-
219
-
220
-
221
-
222
-
223
-
224
-
225
-
226
-
227
-
228
-
229
-
230
-
231
-
232
-
233
-
234
-
235
-
236
-
237
-
238
-
239
-
240
-
241
-
242
-
243
-
244
-
245
-
246
-
247
-
248
-
249
-
250
-
251
-
252
-
253
-
254
-
255
-
256
-
257
-
258
-
259
-
260
-
261
-
262
-
263
-
264
-
265
-
266
-
267
-
268
-
269
-
270
-
271
-
272
-
273
-
274
-
275
-
276
 |
 |

104 Bank of America 2011
allowance for credit losses discussed above. The December 31,
2011 and 2010 ratios above include the PCI loan portfolio.
Excluding the PCI loan portfolio, the allowance for loan and lease
losses as a percentage of total loans and leases outstanding was
2.86 percent at December 31, 2011 compared to 3.94 percent
at December 31, 2010.
Absent unexpected deterioration in the economy, we expect
reductions in the allowance for loan and lease losses to continue
in 2012. However, in both consumer and commercial portfolios,
we expect these reductions to be less than those in 2011 and
2010.
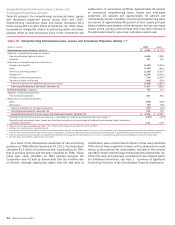
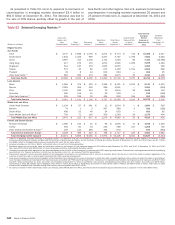
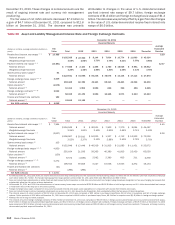
Table 55 presents a rollforward of the allowance for credit
losses for 2011 and 2010.
Table 55
(Dollars in millions)
Allowance for loan and lease losses, January 1 (1)
Loans and leases charged off
Residential mortgage
Home equity
Discontinued real estate
U.S. credit card
Non-U.S. credit card
Direct/Indirect consumer
Other consumer
Total consumer charge-offs
U.S. commercial (2)
Commercial real estate
Commercial lease financing
Non-U.S. commercial
Total commercial charge-offs
Total loans and leases charged off
Recoveries of loans and leases previously charged off
Residential mortgage
Home equity
Discontinued real estate
U.S. credit card
Non-U.S. credit card
Direct/Indirect consumer
Other consumer
Total consumer recoveries
U.S. commercial (3)
Commercial real estate
Commercial lease financing
Non-U.S. commercial
Total commercial recoveries
Total recoveries of loans and leases previously charged off
Net charge-offs
Provision for loan and lease losses
Other (4)
Allowance for loan and lease losses, December 31
Reserve for unfunded lending commitments, January 1
Provision for unfunded lending commitments
Other (5)
Reserve for unfunded lending commitments, December 31
Allowance for credit losses, December 31
Allowance for Credit Losses
2011
$41,885
(4,195)
(4,990)
(106)
(8,114)
(1,691)
(2,190)
(252)
(21,538)
(1,690)
(1,298)
(61)
(155)
(3,204)
(24,742)
363
517
14
838
522
714
50
3,018
500
351
37
3
891
3,909
(20,833)
13,629
(898)
33,783
1,188
(219)
(255)
714
$34,497
2010
$ 47,988
(3,779)
(7,059)
(77)
(13,818)
(2,424)
(4,303)
(320)
(31,780)
(3,190)
(2,185)
(96)
(139)
(5,610)
(37,390)
109
278
9
791
217
967
59
2,430
391
168
39
28
626
3,056
(34,334)
28,195
36
41,885
1,487
240
(539)
1,188
$ 43,073
(1) The 2010 balance includes $10.8 billion of allowance for loan and lease losses related to the adoption of new consolidation guidance.
(2) Includes U.S. small business commercial charge-offs of $1.1 billion and $2.0 billion in 2011 and 2010.
(3) Includes U.S. small business commercial recoveries of $106 million and $107 million in 2011 and 2010.
(4) The 2011 amount includes a $449 million reduction in the allowance for loan and lease losses related to Canadian consumer card loans that were transferred to LHFS.
(5) The 2011 and 2010 amounts primarily represent accretion of the Merrill Lynch purchase accounting adjustment and the impact of funding previously unfunded positions.