Bank of America 2011 Annual Report Download - page 46
Download and view the complete annual report
Please find page 46 of the 2011 Bank of America annual report below. You can navigate through the pages in the report by either clicking on the pages listed below, or by using the keyword search tool below to find specific information within the annual report.-
 1
1 -
2
-
3
-
4
-
5
-
6
-
7
-
8
-
9
-
10
-
11
-
12
-
13
-
14
-
15
-
16
-
17
-
18
-
19
-
20
-
21
-
22
-
23
-
24
-
25
-
26
-
27
-
28
-
29
-
30
-
31
-
32
-
33
-
34
-
35
-
 36
36 -
 37
37 -
 38
38 -
 39
39 -
 40
40 -
 41
41 -
 42
42 -
 43
43 -
 44
44 -
 45
45 -
 46
46 -
 47
47 -
 48
48 -
 49
49 -
 50
50 -
 51
51 -
 52
52 -
 53
53 -
 54
54 -
 55
55 -
 56
56 -
57
-
58
-
59
-
60
-
61
-
62
-
63
-
64
-
65
-
66
-
67
-
68
-
69
-
70
-
71
-
72
-
73
-
74
-
75
-
76
-
77
-
78
-
79
-
80
-
81
-
82
-
83
-
84
-
85
-
86
-
87
-
88
-
89
-
90
-
91
-
92
-
93
-
94
-
95
-
96
-
97
-
98
-
99
-
100
-
101
-
102
-
103
-
104
-
105
-
106
-
107
-
108
-
109
-
110
-
111
-
112
-
113
-
114
-
115
-
116
-
117
-
118
-
119
-
120
-
121
-
122
-
123
-
124
-
125
-
126
-
127
-
128
-
129
-
130
-
131
-
132
-
133
-
134
-
135
-
136
-
137
-
138
-
139
-
140
-
141
-
142
-
143
-
144
-
145
-
146
-
147
-
148
-
149
-
150
-
151
-
152
-
153
-
154
-
155
-
156
-
157
-
158
-
159
-
160
-
161
-
162
-
163
-
164
-
165
-
166
-
167
-
168
-
169
-
170
-
171
-
172
-
173
-
174
-
175
-
176
-
177
-
178
-
179
-
180
-
181
-
182
-
183
-
184
-
185
-
186
-
187
-
188
-
189
-
190
-
191
-
192
-
193
-
194
-
195
-
196
-
197
-
198
-
199
-
200
-
201
-
202
-
203
-
204
-
205
-
206
-
207
-
208
-
209
-
210
-
211
-
212
-
213
-
214
-
215
-
216
-
217
-
218
-
219
-
220
-
221
-
222
-
223
-
224
-
225
-
226
-
227
-
228
-
229
-
230
-
231
-
232
-
233
-
234
-
235
-
236
-
237
-
238
-
239
-
240
-
241
-
242
-
243
-
244
-
245
-
246
-
247
-
248
-
249
-
250
-
251
-
252
-
253
-
254
-
255
-
256
-
257
-
258
-
259
-
260
-
261
-
262
-
263
-
264
-
265
-
266
-
267
-
268
-
269
-
270
-
271
-
272
-
273
-
274
-
275
-
276
 |
 |

44 Bank of America 2011
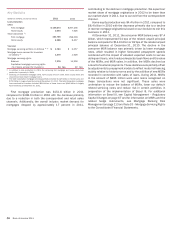
Income tax expense included a $774 million charge to reduce
the carrying value of the deferred tax assets as a result of a
reduction in the U.K. corporate income tax rate enacted during
2011 compared to a charge of $388 million for a rate reduction
enacted in 2010. For additional information related to the U.K.
corporate income tax rate reduction, see Financial Highlights –
Income Tax Expense on page 28.
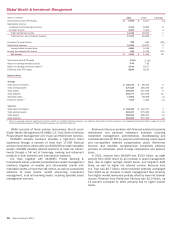
The return on average economic capital decreased due to lower
net income partially offset by a 33 percent decrease in average
economic capital due to reductions in credit risk driven by improved
risk ratings, lower counterparty credit risk and a decline in market
risk-related trading exposures. Average allocated equity decreased
due to the same reasons as economic capital. For more
information regarding economic capital and allocated equity, see
Supplemental Financial Data on page 32.
Sales and trading revenue and investment banking fees may
continue to be adversely affected in 2012 by lower client activity
and challenging market conditions as a result of, among other
things, the European sovereign debt crisis, uncertainty regarding
the outcome of the evolving domestic regulatory landscape, our
credit ratings and market volatility.
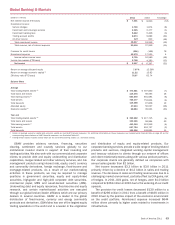
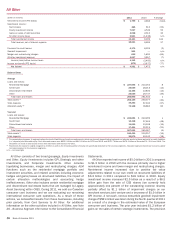
Components of Global Banking & Markets
Sales and Trading Revenue
Sales and trading revenue is segregated into fixed income
including investment and non-investment grade corporate debt
obligations, commercial mortgage-backed securities, residential
mortgage-backed securities (RMBS), swaps and collateralized
debt obligations (CDOs); currencies including interest rate and
foreign exchange contracts; commodities including primarily
futures, forwards and options; and equity income from equity-linked
derivatives and cash equity activity.
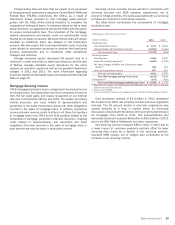
Sales and Trading Revenue (1)
(Dollars in millions)
Fixed income, currencies and commodities
Equity income
Total sales and trading revenue
2011
$ 8,868
3,968
$ 12,836
2010
$ 12,857
4,155
$ 17,012
(1) Includes a FTE adjustment of $202 million and $274 million for 2011 and 2010. For additional
information on sales and trading revenue, including sales and trading investment and brokerage
services and net interest income, see Note 4 – Derivatives to the Consolidated Financial
Statements.
Fixed income, currencies and commodities (FICC) revenue
decreased $4.0 billion, or 31 percent, to $8.9 billion in 2011
compared to 2010 primarily due to lower client activity and
continued adverse market conditions impacting our mortgage
products, credit, and rates and currencies businesses, partially
offset by DVA gains, net of hedges. Equity income decreased $187
million, or five percent, to $4.0 billion in 2011 compared to 2010
primarily due to lower equity derivative trading volumes. Sales and
trading revenue included total commissions and brokerage fee
revenue of $2.3 billion ($2.2 billion from equities and $144 million
from FICC) in 2011 compared to $2.4 billion ($2.2 billion from
equities and $148 million from FICC) in 2010.
In conjunction with regulatory reform measures and our
initiative to optimize our balance sheet, we exited our stand-alone
proprietary trading business as of June 30, 2011, which involved
trading activities in a variety of products, including stocks, bonds,
currencies and commodities. Proprietary trading revenue was
$434 million for the six months ended June 30, 2011 compared
to $1.4 billion for 2010. For additional information on restrictions
on proprietary trading, see Regulatory Matters – Limitations on
Proprietary Trading on page 60.
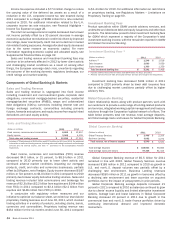
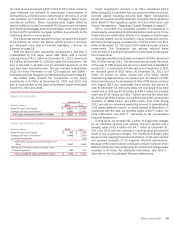
Investment Banking Fees
Product specialists within GBAM provide advisory services, and
underwrite and distribute debt and equity issuances and other loan
products. The table below presents total investment banking fees
for GBAM which represent a majority of the Corporation’s total
investment banking income, with the remainder reported in GWIM
and Global Commercial Banking.
Investment Banking Fees (1)
(Dollars in millions)
Advisory (2)
Debt issuance
Equity issuance
Total investment banking fees
2011
$ 1,246
2,693
1,303
$ 5,242
2010
$ 1,018
3,059
1,329
$ 5,406
(1) Includes self-led deals of $372 million and $264 million for 2011 and 2010.
(2) Advisory includes fees on debt and equity advisory services and mergers and acquisitions.
Investment banking fees decreased $164 million in 2011
compared to 2010 primarily driven by lower debt issuance fees
due to challenging market conditions partially offset by higher
advisory fees.
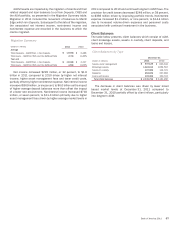
Global Corporate Banking
Client relationship teams along with product partners work with
our customers to provide a wide range of lending-related products
and services, integrated working capital management and treasury
solutions through the Corporation’s global network of offices. The
table below presents total net revenue, total average deposits,
and total average loans and leases for Global Corporate Banking.
Global Corporate Banking
(Dollars in millions)
Global Treasury Services
Business Lending
Total revenue, net of interest expense
Total average deposits
Total average loans and leases
2011
$ 2,448
3,092
$ 5,540
$ 108,663
97,346
2010
$ 2,259
3,272
$ 5,531
$ 90,083
81,415
Global Corporate Banking revenue of $5.5 billion for 2011
remained in line with 2010. Global Treasury Services revenue
increased $189 million in 2011 compared to 2010 as growth in
U.S. and non-U.S. deposit volumes was partially offset by a
challenging rate environment. Business Lending revenues
decreased $180 million in 2011 as growth in loans was offset by
a declining rate environment and lower accretion on acquired
portfolios due to the impact of prepayments in prior periods.
Global Corporate Banking average deposits increased 21
percent in 2011 compared to 2010 as balances continued to grow
due to clients’ excess liquidity and limited alternative investment
options. Average loan and lease balances in Global Corporate
Banking increased 20 percent in 2011 due to growth in the
commercial loan and non-U.S. trade finance portfolios driven by
continuing international demand and improved domestic
momentum.