Bank of America 2011 Annual Report Download - page 93
Download and view the complete annual report
Please find page 93 of the 2011 Bank of America annual report below. You can navigate through the pages in the report by either clicking on the pages listed below, or by using the keyword search tool below to find specific information within the annual report.-
 1
1 -
2
-
3
-
4
-
5
-
6
-
7
-
8
-
9
-
10
-
11
-
12
-
13
-
14
-
15
-
16
-
17
-
18
-
19
-
20
-
21
-
22
-
23
-
24
-
25
-
26
-
27
-
28
-
29
-
30
-
31
-
32
-
33
-
34
-
35
-
36
-
37
-
38
-
39
-
40
-
41
-
42
-
43
-
44
-
45
-
46
-
47
-
48
-
49
-
50
-
51
-
52
-
53
-
54
-
55
-
56
-
57
-
58
-
59
-
60
-
61
-
62
-
63
-
64
-
65
-
66
-
67
-
68
-
69
-
70
-
71
-
72
-
73
-
74
-
75
-
76
-
77
-
78
-
79
-
80
-
81
-
82
-
 83
83 -
 84
84 -
 85
85 -
 86
86 -
 87
87 -
 88
88 -
 89
89 -
 90
90 -
 91
91 -
 92
92 -
 93
93 -
 94
94 -
 95
95 -
 96
96 -
 97
97 -
 98
98 -
 99
99 -
 100
100 -
 101
101 -
 102
102 -
 103
103 -
104
-
105
-
106
-
107
-
108
-
109
-
110
-
111
-
112
-
113
-
114
-
115
-
116
-
117
-
118
-
119
-
120
-
121
-
122
-
123
-
124
-
125
-
126
-
127
-
128
-
129
-
130
-
131
-
132
-
133
-
134
-
135
-
136
-
137
-
138
-
139
-
140
-
141
-
142
-
143
-
144
-
145
-
146
-
147
-
148
-
149
-
150
-
151
-
152
-
153
-
154
-
155
-
156
-
157
-
158
-
159
-
160
-
161
-
162
-
163
-
164
-
165
-
166
-
167
-
168
-
169
-
170
-
171
-
172
-
173
-
174
-
175
-
176
-
177
-
178
-
179
-
180
-
181
-
182
-
183
-
184
-
185
-
186
-
187
-
188
-
189
-
190
-
191
-
192
-
193
-
194
-
195
-
196
-
197
-
198
-
199
-
200
-
201
-
202
-
203
-
204
-
205
-
206
-
207
-
208
-
209
-
210
-
211
-
212
-
213
-
214
-
215
-
216
-
217
-
218
-
219
-
220
-
221
-
222
-
223
-
224
-
225
-
226
-
227
-
228
-
229
-
230
-
231
-
232
-
233
-
234
-
235
-
236
-
237
-
238
-
239
-
240
-
241
-
242
-
243
-
244
-
245
-
246
-
247
-
248
-
249
-
250
-
251
-
252
-
253
-
254
-
255
-
256
-
257
-
258
-
259
-
260
-
261
-
262
-
263
-
264
-
265
-
266
-
267
-
268
-
269
-
270
-
271
-
272
-
273
-
274
-
275
-
276
 |
 |

Bank of America 2011 91
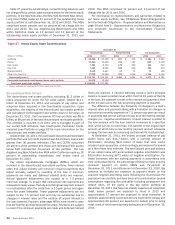
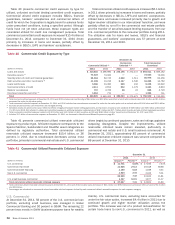
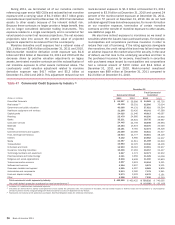
the transfer of securities-based lending loans to the consumer
portfolio earlier in 2011, which together totaled $5.3 billion.
Reservable criticized balances and nonperforming loans and
leases declined $5.5 billion and $1.3 billion in 2011. The declines
were broad-based in terms of clients and industries and were driven
by improved client credit profiles and liquidity. Net charge-offs
decreased $686 million in 2011 due to broad-based declines from
credit quality improvements mentioned above, driving lower charge-
offs and higher recoveries.
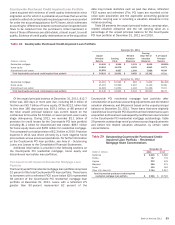
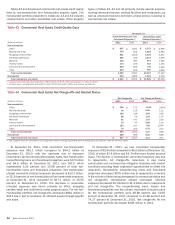
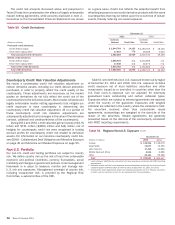
Commercial Real Estate
The commercial real estate portfolio is predominantly managed in
Global Commercial Banking and consists of loans made primarily
to public and private developers, homebuilders and commercial
real estate firms. Outstanding loans decreased $9.8 billion in
2011 due to paydowns and sales, which outpaced new originations
and renewals. Over 90 percent of this decrease occurred within
reservable criticized.
The portfolio remains diversified across property types and
geographic regions. California represented the largest state
concentration of commercial real estate loans and leases at 20
percent and 18 percent at December 31, 2011 and 2010. For
more information on geographic and property concentrations, see
Table 42.
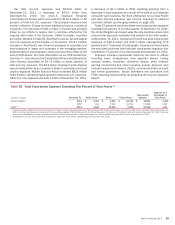
Credit quality for commercial real estate continued to show
signs of improvement; however, we expect that elevated
unemployment and ongoing pressure on vacancy and rental rates
will continue to affect primarily the non-homebuilder portfolio.
Nonperforming commercial real estate loans and foreclosed
properties decreased 31 percent in 2011, split evenly across the
homebuilder and non-homebuilder portfolios. The decline in
nonperforming loans and foreclosed properties in the non-
homebuilder portfolio was driven by decreases in the shopping
centers/retail, land and land development, and office property
types. Reservable criticized balances decreased $9.0 billion
primarily due to declines in the office, shopping centers/retail and
multi-family rental property types in the non-homebuilder portfolio
and improvement in the homebuilder portfolio. Net charge-offs
declined $1.1 billion in 2011 due to improvement in both the
homebuilder and non-homebuilder portfolio.
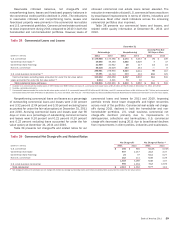
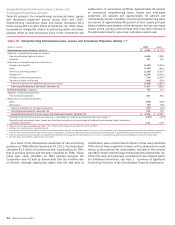
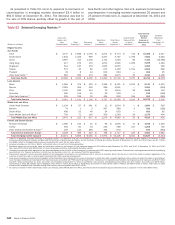
Table 42 presents outstanding commercial real estate loans
by geographic region which is based on the geographic location of
the collateral and property type. Commercial real estate primarily
includes commercial loans and leases secured by non-owner-
occupied real estate which is dependent on the sale or lease of
the real estate as the primary source of repayment.
Table 42
(Dollars in millions)
By Geographic Region
California
Northeast
Southwest
Southeast
Midwest
Florida
Illinois
Midsouth
Northwest
Non-U.S.
Other (1)
Total outstanding commercial real estate loans (2)
By Property Type
Non-homebuilder
Office
Multi-family rental
Shopping centers/retail
Industrial/warehouse
Multi-use
Hotels/motels
Land and land development
Other
Total non-homebuilder
Homebuilder
Total outstanding commercial real estate loans (2)
Outstanding Commercial Real Estate Loans
December 31
2011
$ 7,957
6,554
5,243
4,844
4,051
2,502
1,871
1,751
1,574
1,824
1,425
$39,596
$ 7,571
6,105
5,985
3,988
3,218
2,653
1,599
6,050
37,169
2,427
$39,596
2010
$ 9,012
7,639
6,169
5,806
5,301
3,649
2,811
2,627
2,243
2,515
1,701
$ 49,473
$ 9,688
7,721
7,484
5,039
4,266
2,650
2,376
5,950
45,174
4,299
$ 49,473
(1) Other states primarily represents properties in the states of Colorado, Utah, Hawaii, Wyoming and Montana.
(2) Includes commercial real estate loans accounted for under the fair value option of $79 million at December 31, 2010, none at December 31, 2011.
During 2011, we continued to see improvement in the
homebuilder portfolio. Certain portions of the non-homebuilder
portfolio remain at risk as occupancy rates, rental rates and
commercial property prices remain under pressure. We use a
number of proactive risk mitigation initiatives to reduce utilized
and potential exposure in the commercial real estate portfolios
including refinement of our credit standards, additional transfers
of deteriorating exposures to management by independent special
asset officers and the pursuit of alternative resolution methods
to achieve the best results for our customers and the Corporation.